Figure 2.

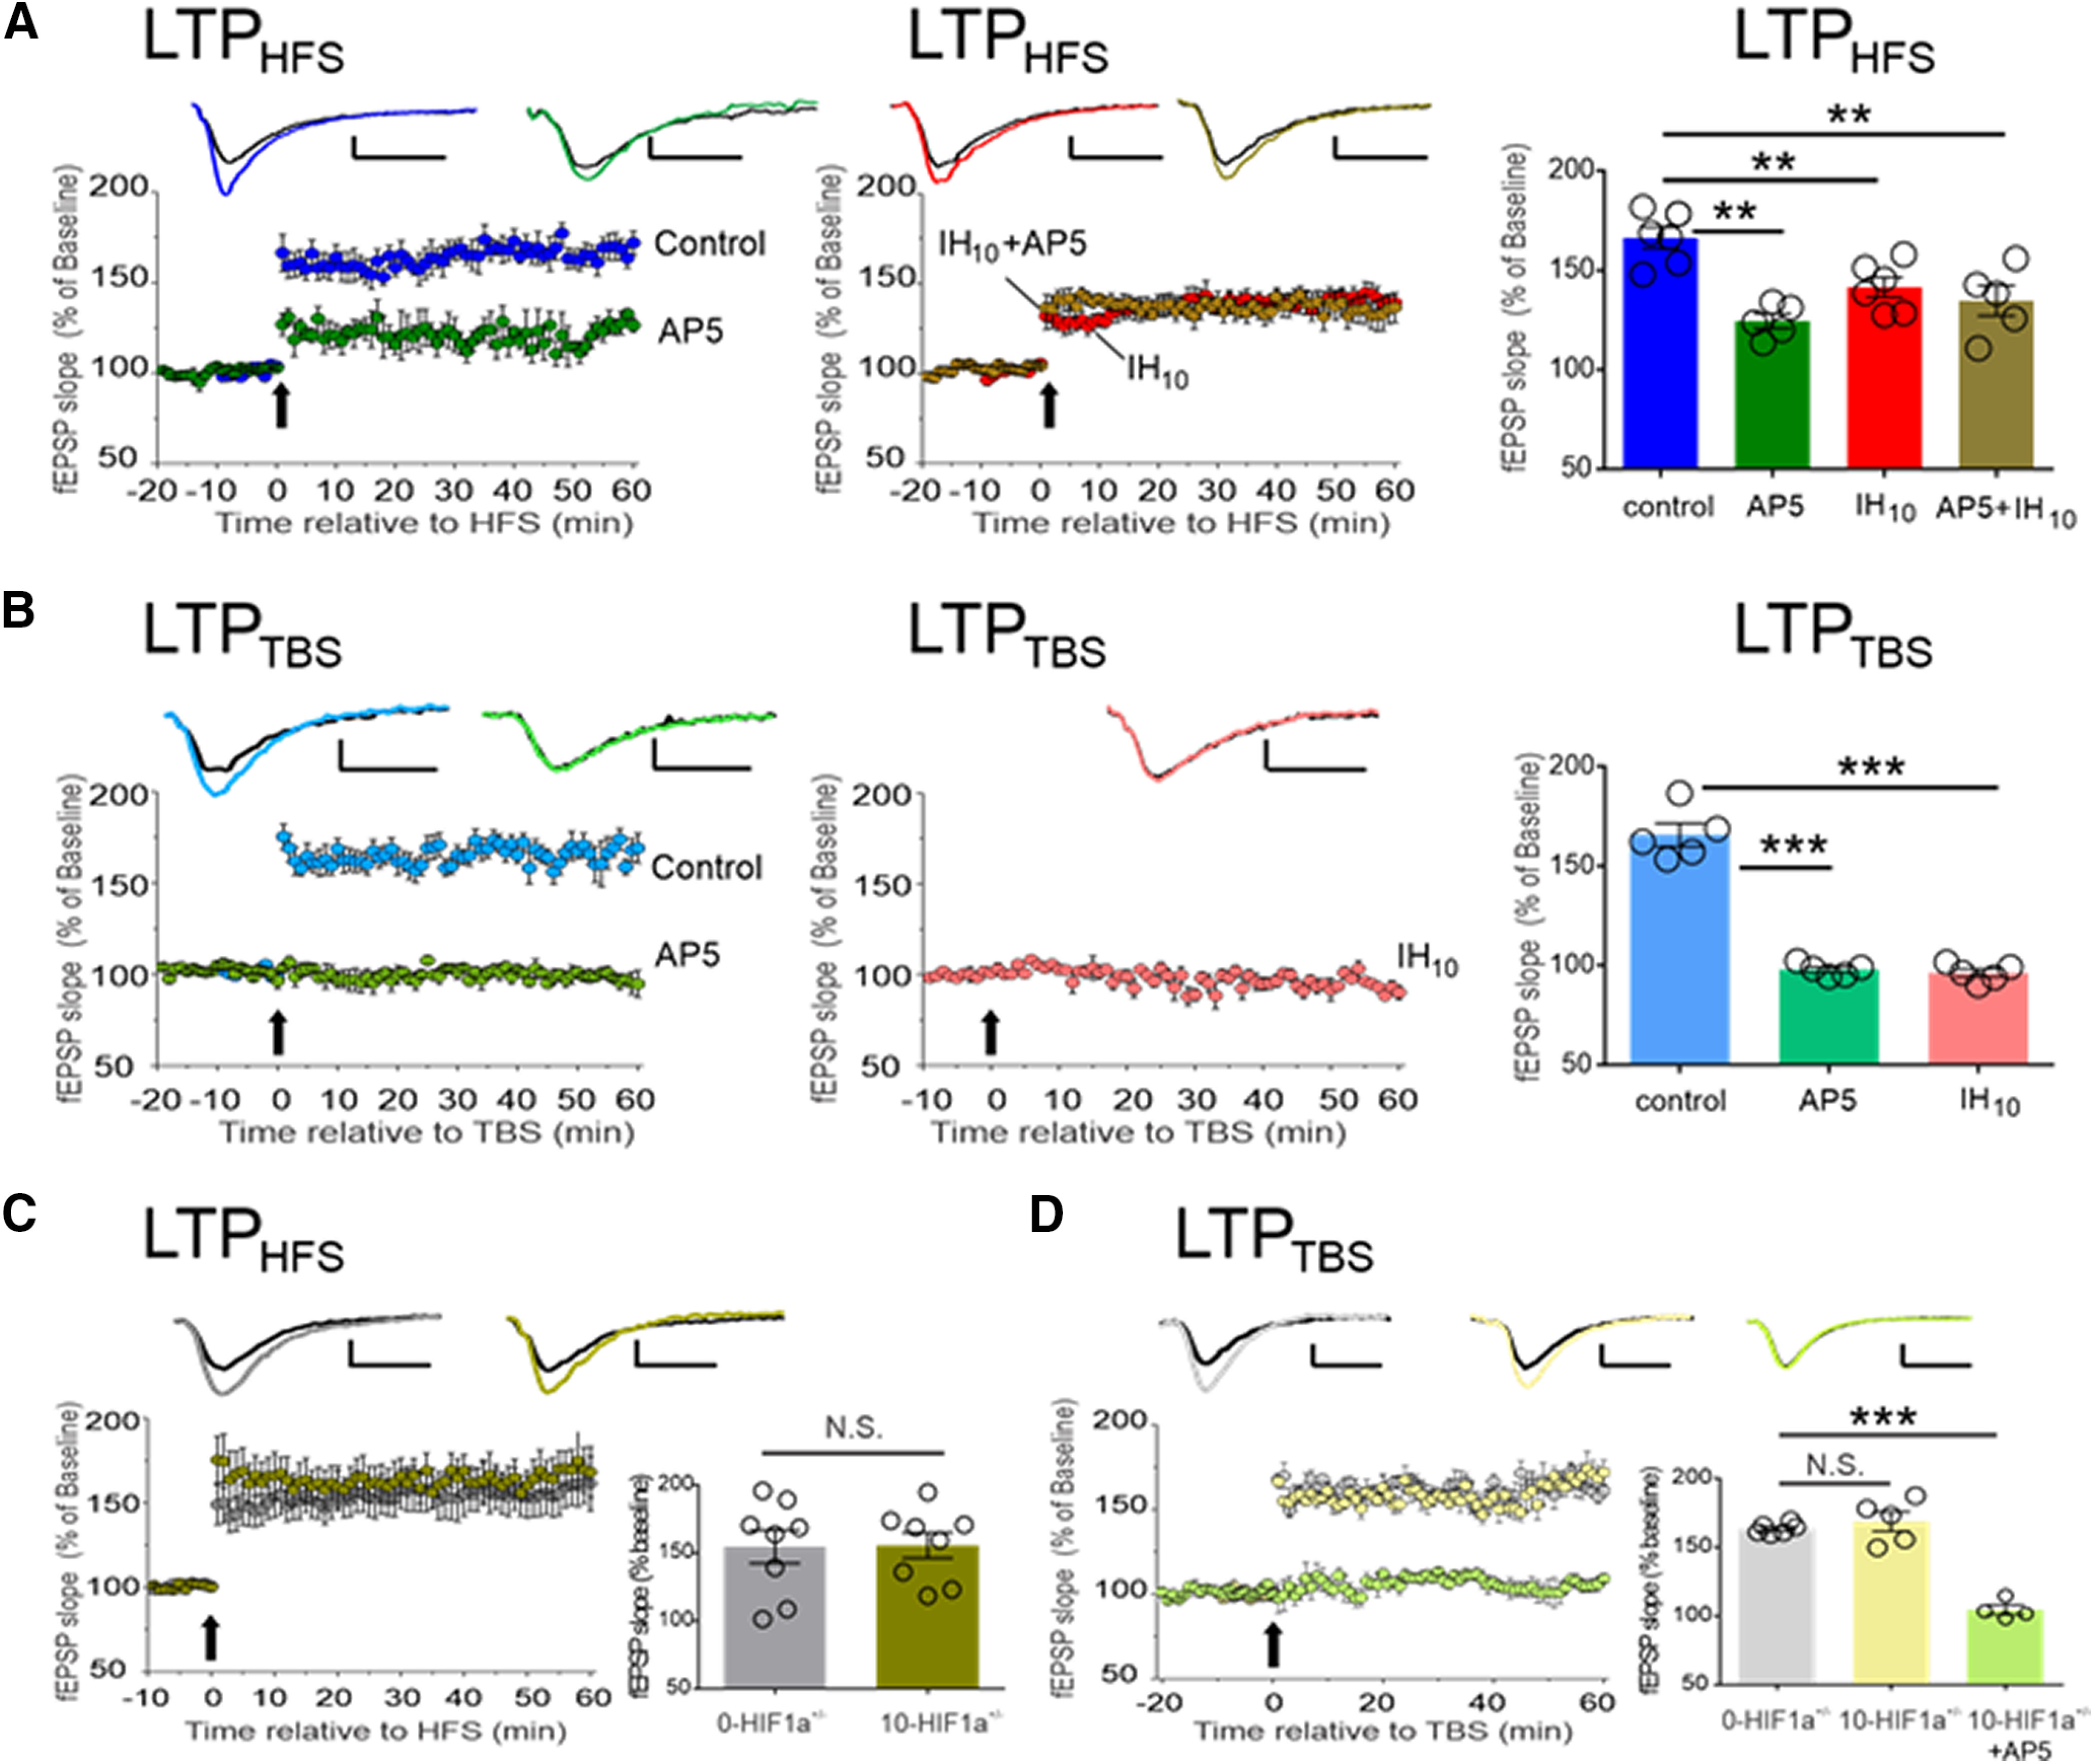
IH suppresses NMDAr-dependent synaptic potentiation in wild-type hippocampal slices, but NMDAr-dependent LTP is unaffected by IH in the hippocampal slices from HIF1a+/−. A, LTP was evoked using HFS in control (blue, n = 6) is attenuated by AP5 (green, n = 5). LTPHFS is attenuated in following IH (IH10, red, n = 6) and is no longer sensitive to AP5 (IH+AP5, gold, n = 5). A comparison of LTPHFS magnitude (60 min following HFS) was performed to compare experimental conditions to control; **p < 0.01. B, LTPTBS is readily evoked in control (light blue, n = 5) and is completely blocked by AP5 (light green, n = 5). Following IH, LTPTBS is present (IH10, pink, n = 5). Following a one-way ANOVA, a post hoc comparison of LTPTBS magnitude (60 min following TBS) was performed to compare experimental conditions to control; ***p < 0.01. C, LTPHFS was evoked in both 0-HIF1a+/− (n = 8, gray) and 10-HIF1a+/− (n = 8, dark yellow). No difference was found when comparing LTPHFS magnitude between 0-HIF1a+/− and 10-HIF1a+/− (p = 0.94). D, LTPTBS was evoked in both 0-HIF1a+/− (n = 6, light gray), 10-HIF1a+/− (n = 5, light yellow), and 10-HIF1a+/− + AP5 (n = 5, light green). No difference was found when comparing LTPTBS magnitude of 0-HIF1a+/− and 10-HIF1a+/−. Representative traces illustrate baseline (black) and 60 min following HFS (colored trace). Scale bars: 0.2 mV/10 ms. In experiments using AP5, electrophysiological recordings began at 20 min before eliciting LTP (i.e., t = −20) while AP5 was applied 10 before eliciting LTP (i.e., t = −10). For all the experiment, the arrow represents the electric protocols: HFS or TBS; ***p < 0.001, **p < 0.01; N.S., p > 0.05.
