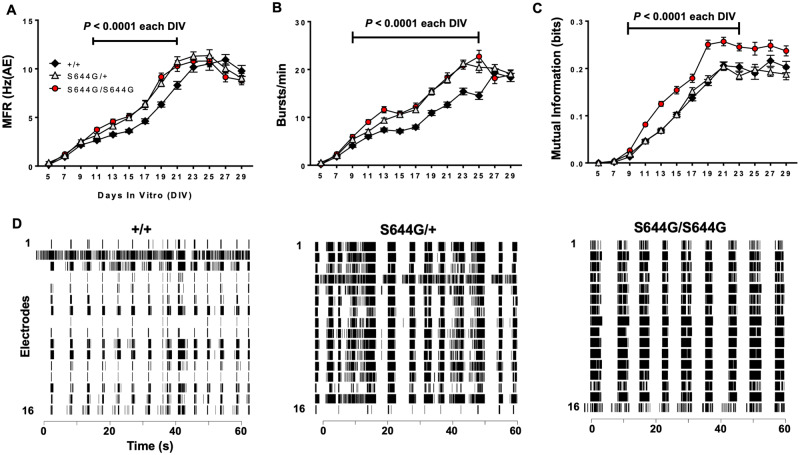
Figure 6.
MEA network phenotypes. We analysed the activity of cortical neural networks from six litters of wild-type (+/+, n = 108 wells) and S644G/+ (n = 107 wells), and five litters of S644G/S644G (n = 80 wells) mice. (A) Mutant neurons exhibit significantly elevated mean firing rate (MFR; expressed relative to the number of active electrodes). (B) Both mutant genotypes have a significantly higher burst rate compared to wild-type. (C) S644G/S644G networks display an increased local synchrony compared to both S644G/+ and wild-type. Error bars in A–C indicate SEM. (D) Representative raster plots of network activity at DIV21 for each genotype. For statistical analysis, features from DIV9–29 were each rank- and then normal quantile-transformed and fit in a least-squares regression model using genotype and plate as covariates. The P-values obtained for genotype effect were adjusted using a Bonferroni correction for the 11 DIVs analysed for each feature. For genotype effects significant (P < 0.05) after Bonferroni correction, a post hoc Dunnet’s test was used (alpha = 0.05) to examine the effect of heterozygosity or homozygosity with wild-type as control. Supplementary Table 3 shows the genotype effect and plate effect P-values.

