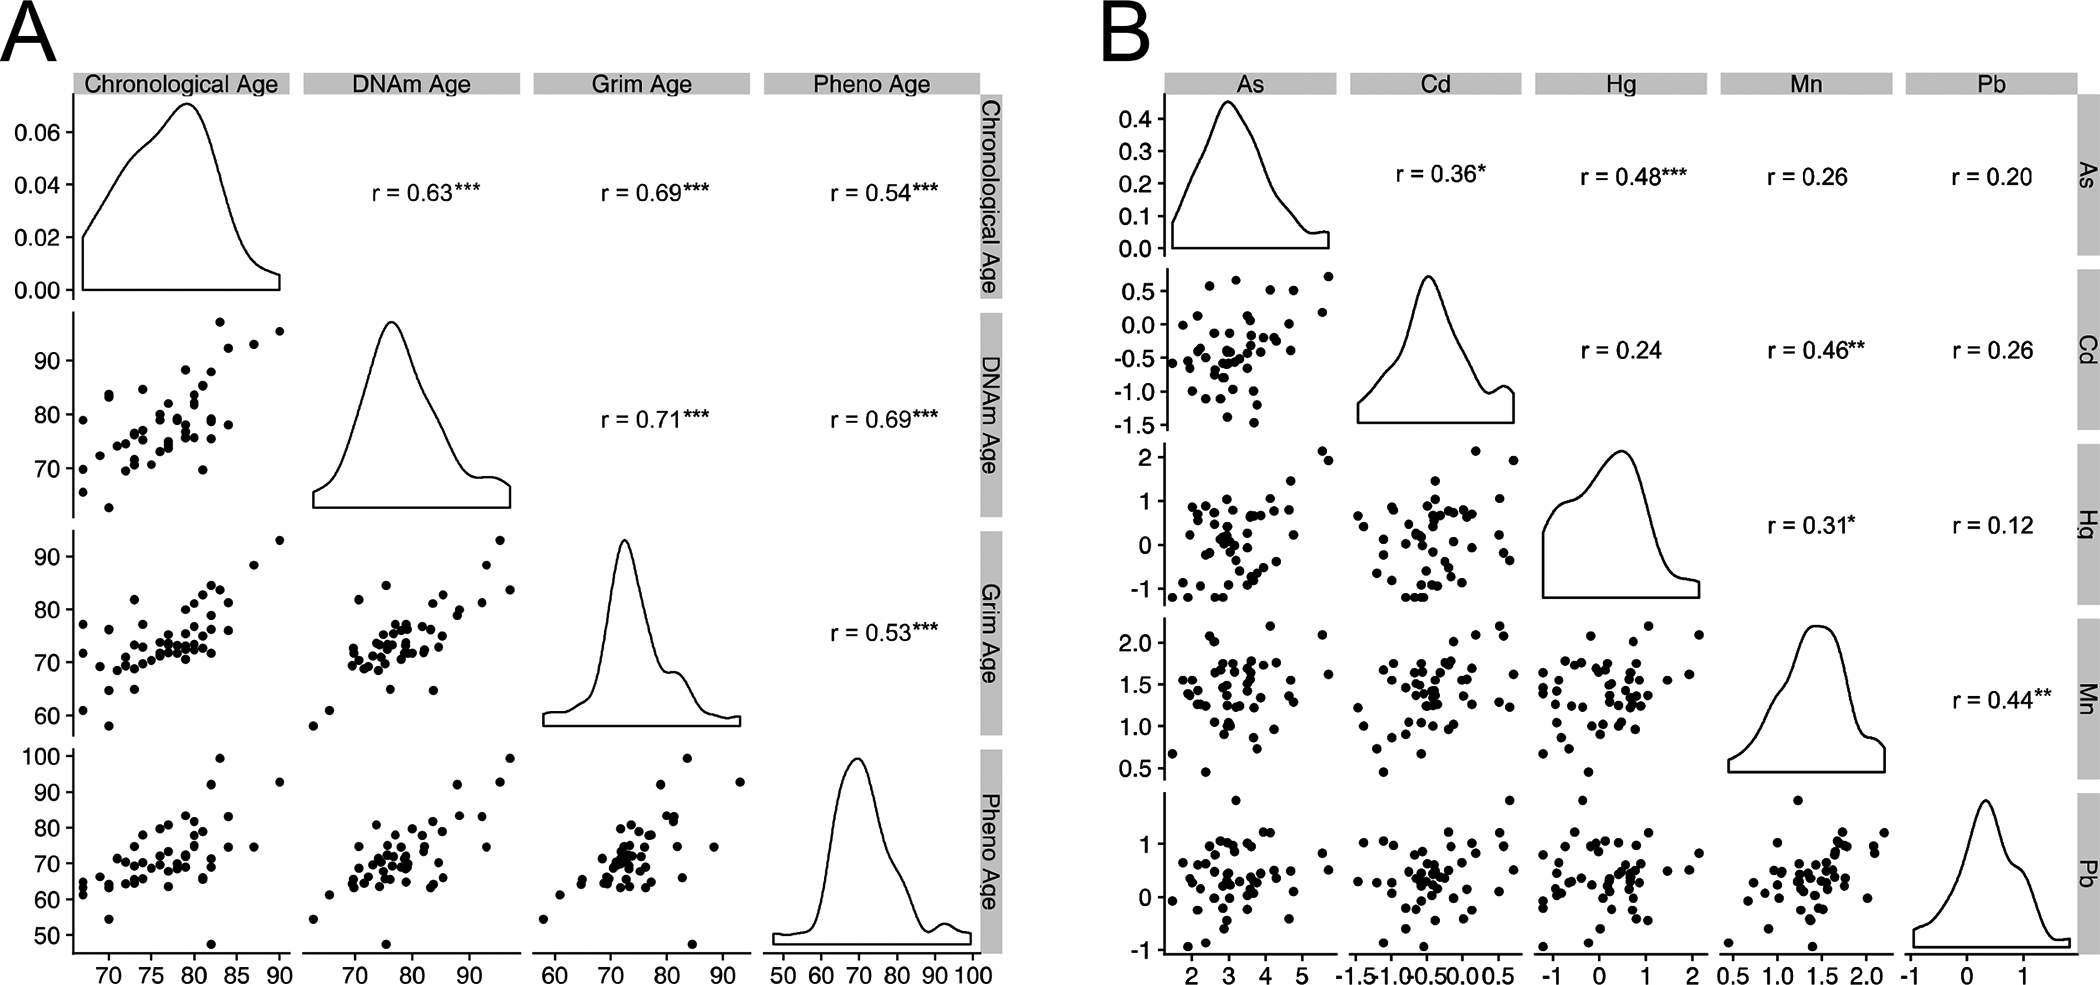
Figure 1 |. orrelation Matrices of Age and Metal Variables.

Pearson correlation matrices of [A] age variables and [B] urine metal concentrations across participants in the study sample. All correlations are based on the full cohort (N = 48). For the correlation matrix, all metals with the exception of Mn were log transformed to achieve distributions closer to normal. For uniformity, all metals were log transformed in the BKMR analyses. Subsequent Rosner’s tests did not reveal any outliers in the metal concentration levels. Asterisks denote statistical significance of correlations:
* = P < 0.05, ** = P < 0.01, *** = P < 0.001.
