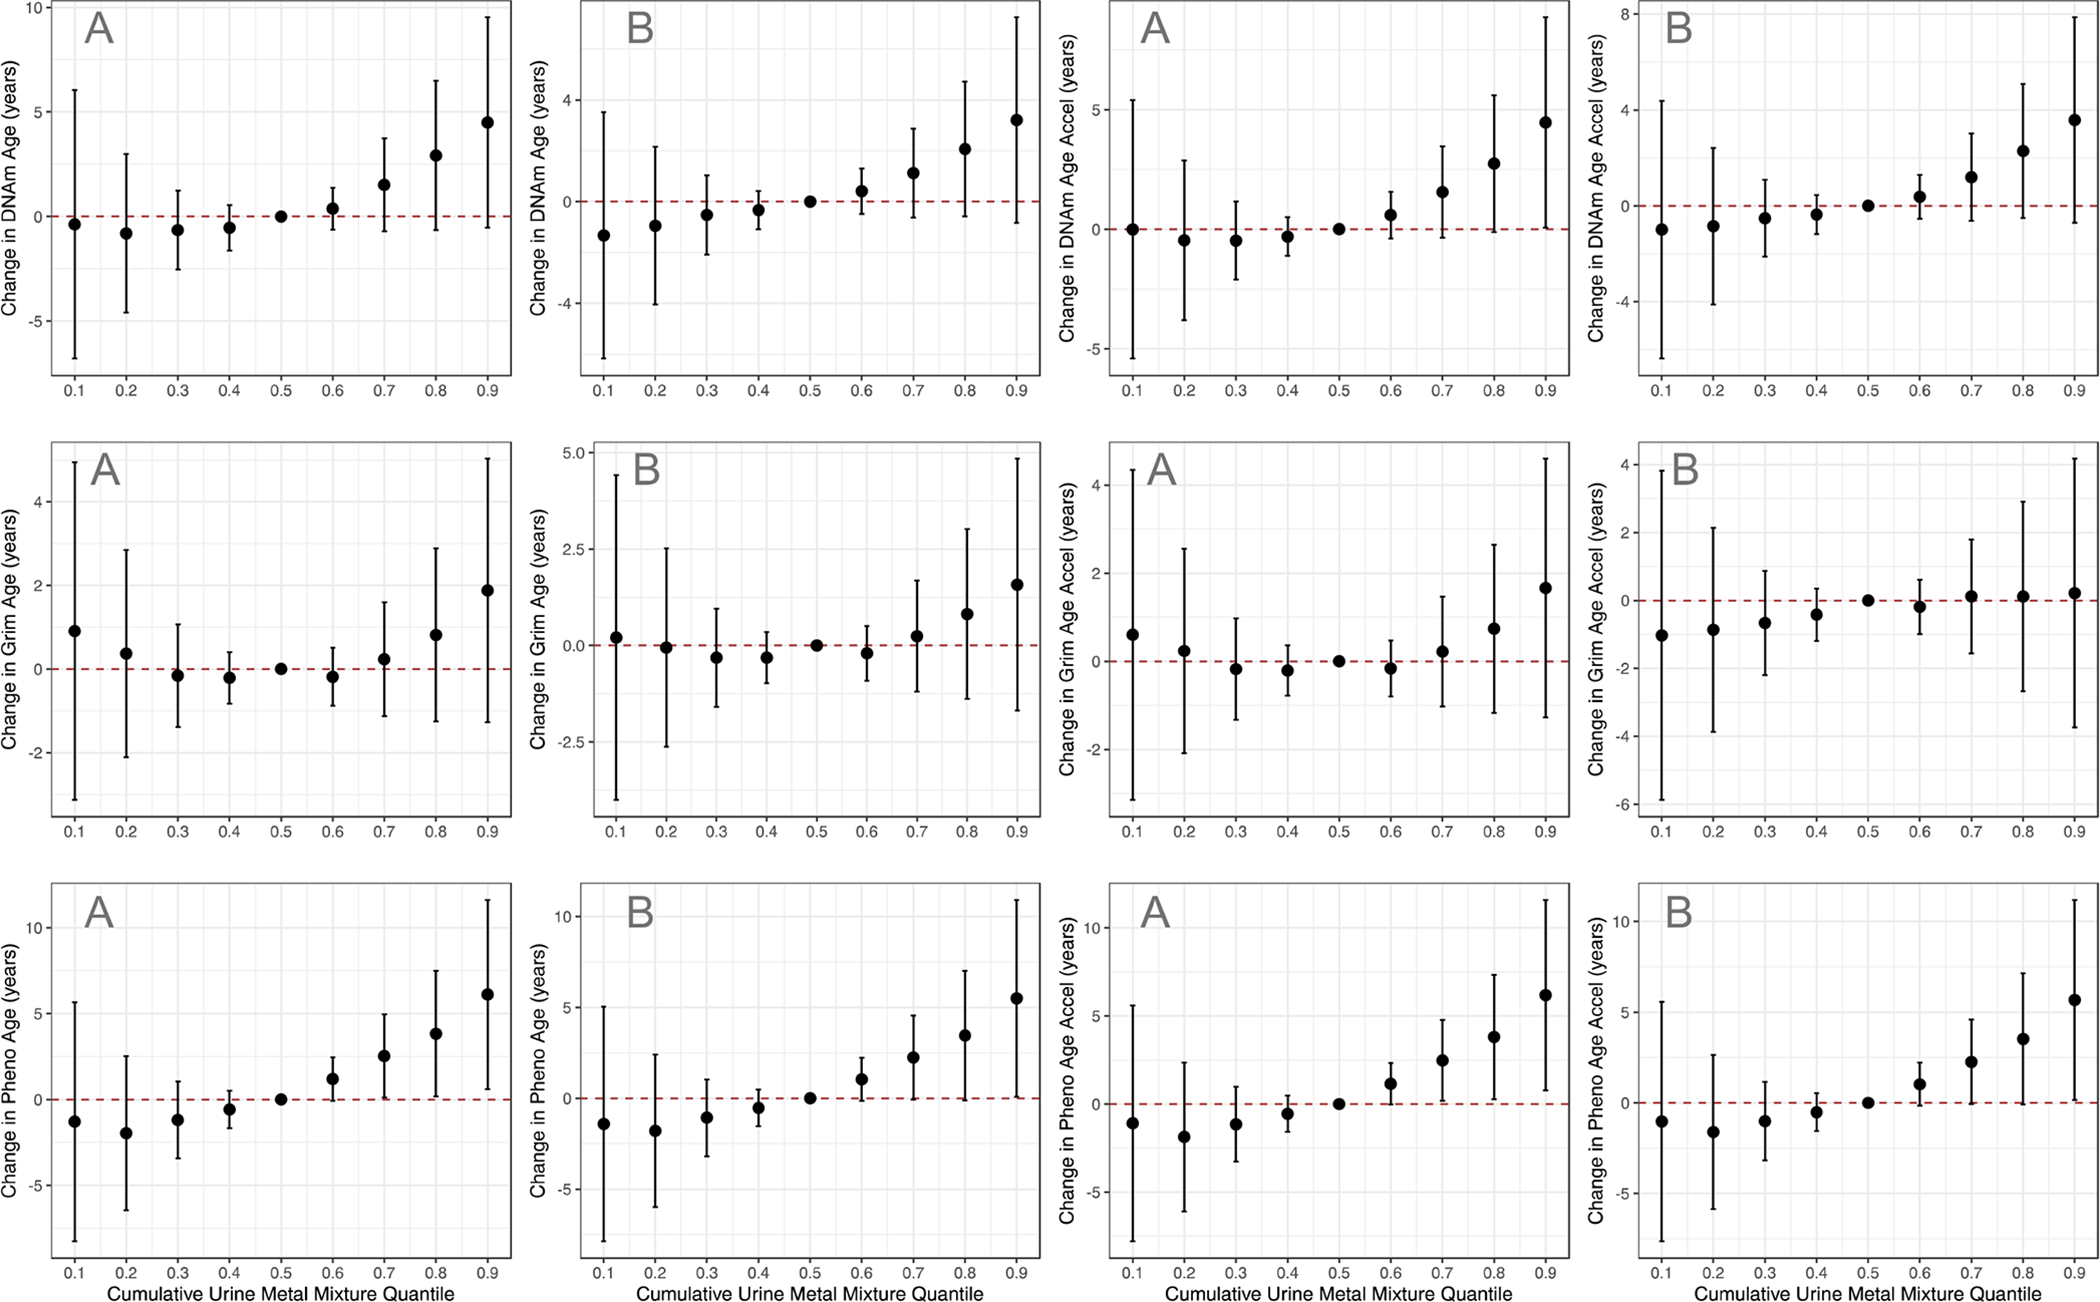
Figure 2 |. Relationships between Cumulative Metal Mixtures and DNA Methylation Age Variables.

Difference in DNA methylation age variables (95% CI) of cumulative urine metal mixture exposure in the [A] main analysis models, and [B] sensitivity analysis models including the diseases diabetes, hypertension, and ischemic heart disease. In each BKMR model, all urine metals at the specified percentiles (x-axis) were compared to a model with all urine metals at their 50th percentile.
