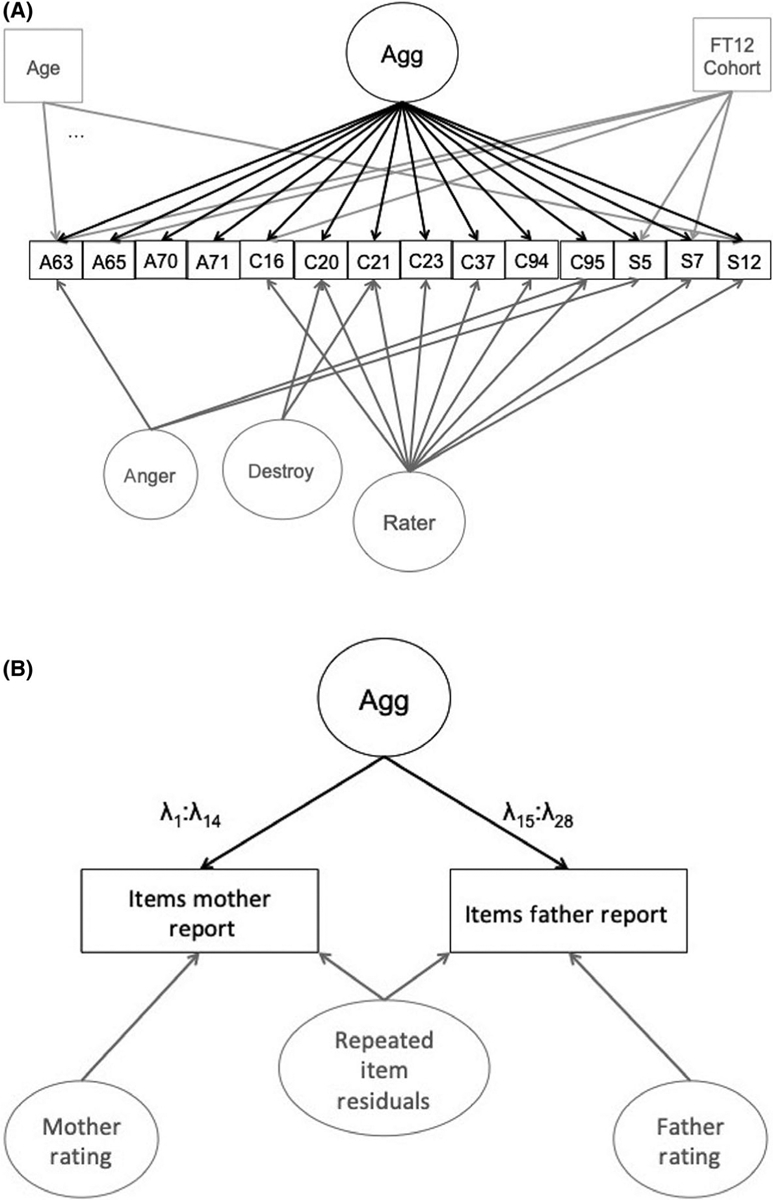
Figure 1.

Path diagram of an adapted multi-rater bi-factor model fitted to data across three questionnaires, two raters, and six cohorts. The key paths of interest are in black. Gray paths are estimated, but are of secondary interest, accounting for additional sources of covariance (rater, item residuals) or adjusting for covariates (age, FinnTwinn12 cohort). λ represent the factor loadings, and the different subscripts of the items loading on aggression for mother and father items indicate that they have different weights. Repeated item residuals (e.g., a residual between mother report CBCL16 and father report CBCL16) have fixed loadings across rater. Note: Agg = aggression; A = ATAC; C = CBCL; S = SDQ; FT12 = FinnTwin12
