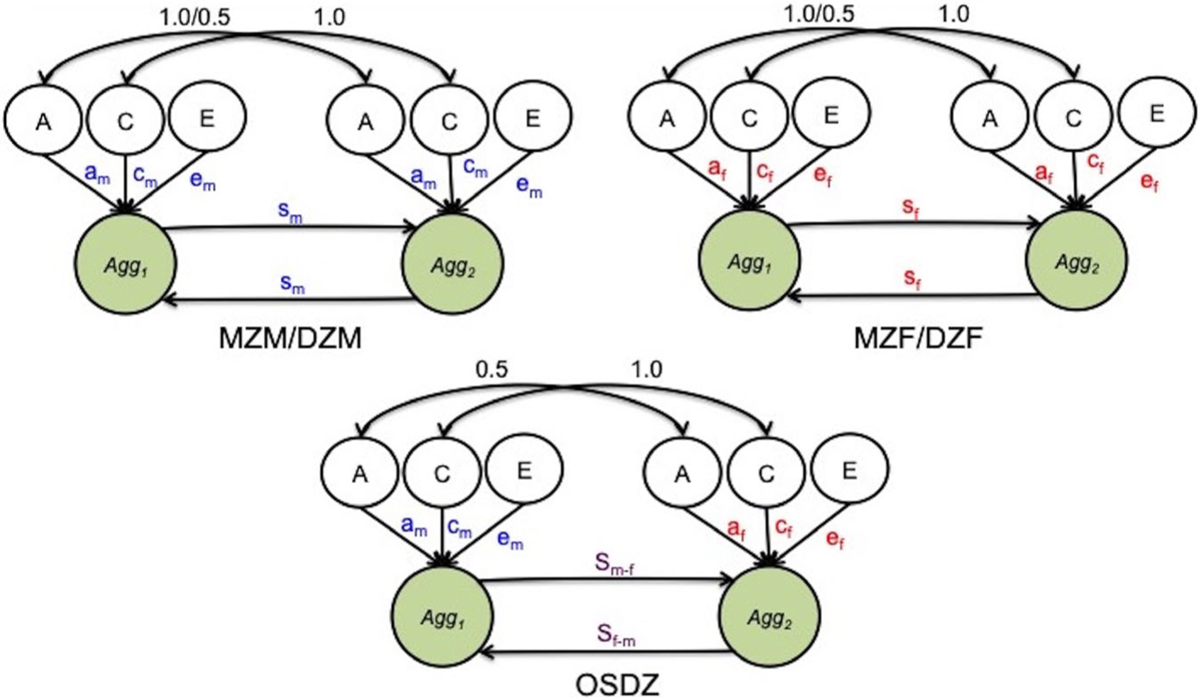
Figure 2.

Path diagram of common effects sex-limitation model with unique ‘c’ and ‘e’ paths for the OSDZ group, with unique sibling interactions added. NOTE: colors correspond to model parameters that vary across groups

Path diagram of common effects sex-limitation model with unique ‘c’ and ‘e’ paths for the OSDZ group, with unique sibling interactions added. NOTE: colors correspond to model parameters that vary across groups