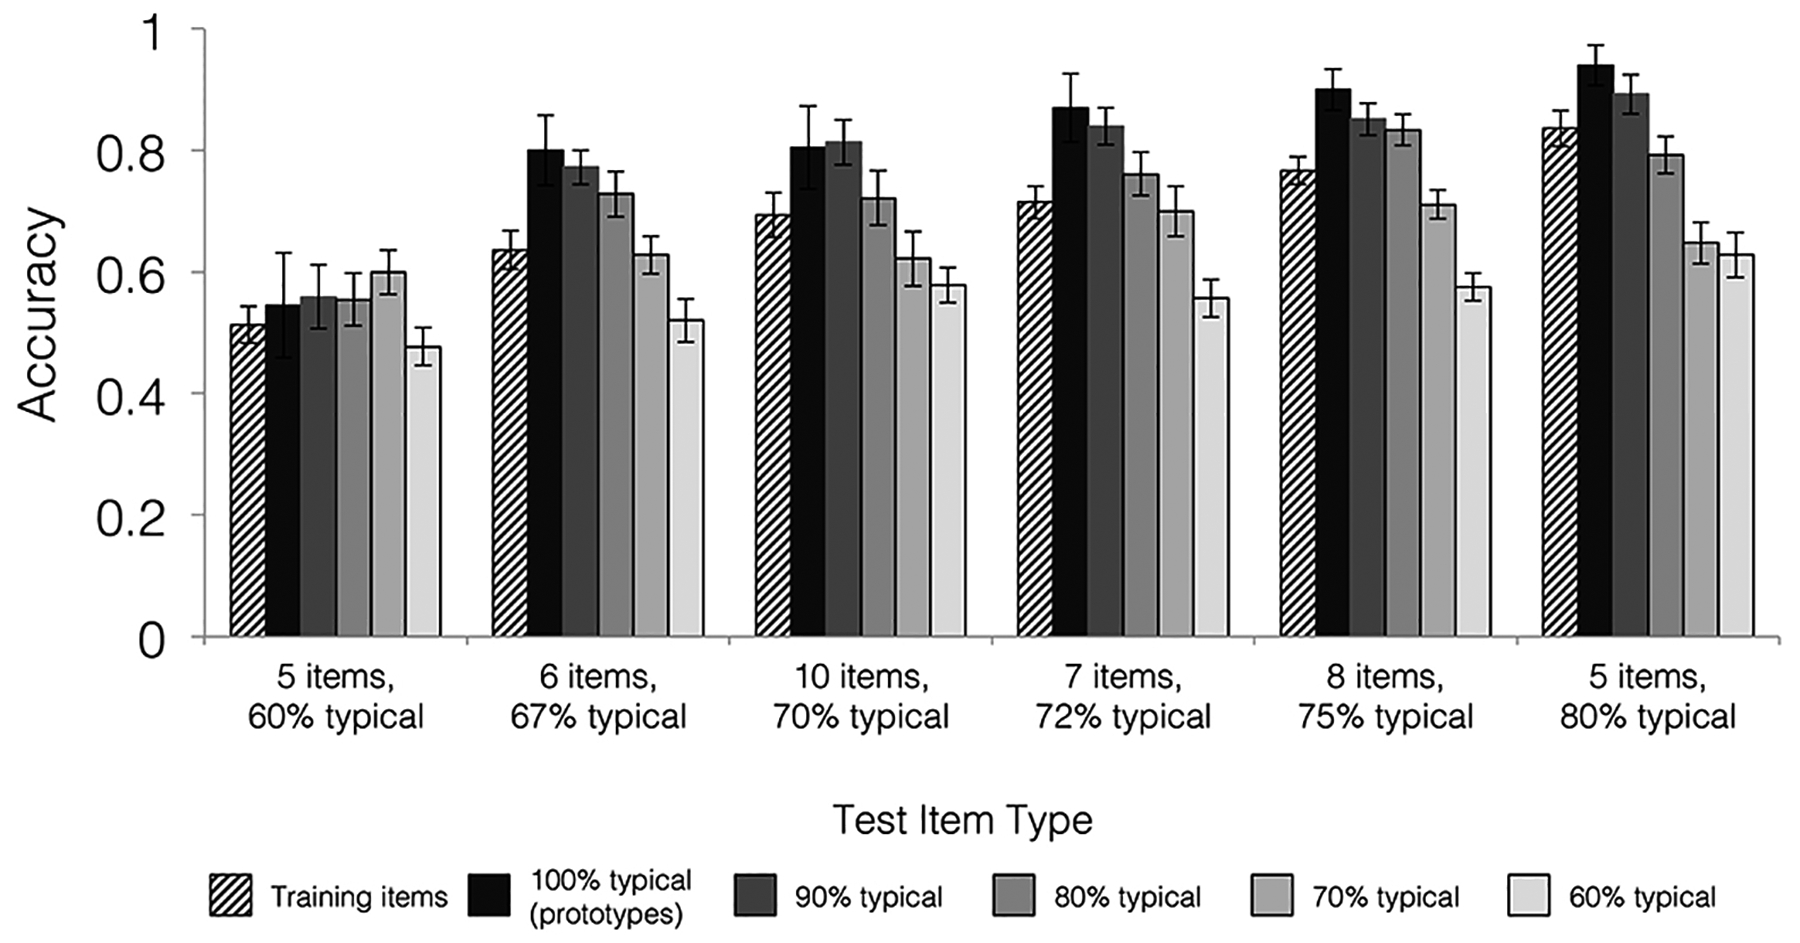
Figure 3.

Categorization accuracy for each item type separated by training set. Training sets are organized with increasing coherence from left to right, with specific coherence levels indicated by the percentages on the x-axis. Training set size is indicated on the x-axis by the number of items per category. Accuracies on training (old) items re-presented during the categorization test are depicted with striped bars. Accuracies for new items (common across all groups) varying in their similarity to category prototypes are depicted with solid bars. Accuracies for prototypes are depicted in the darkest bars with increasingly lighter bars for new items sharing fewer features with the prototypes. Error bars depict standard error of the mean.
