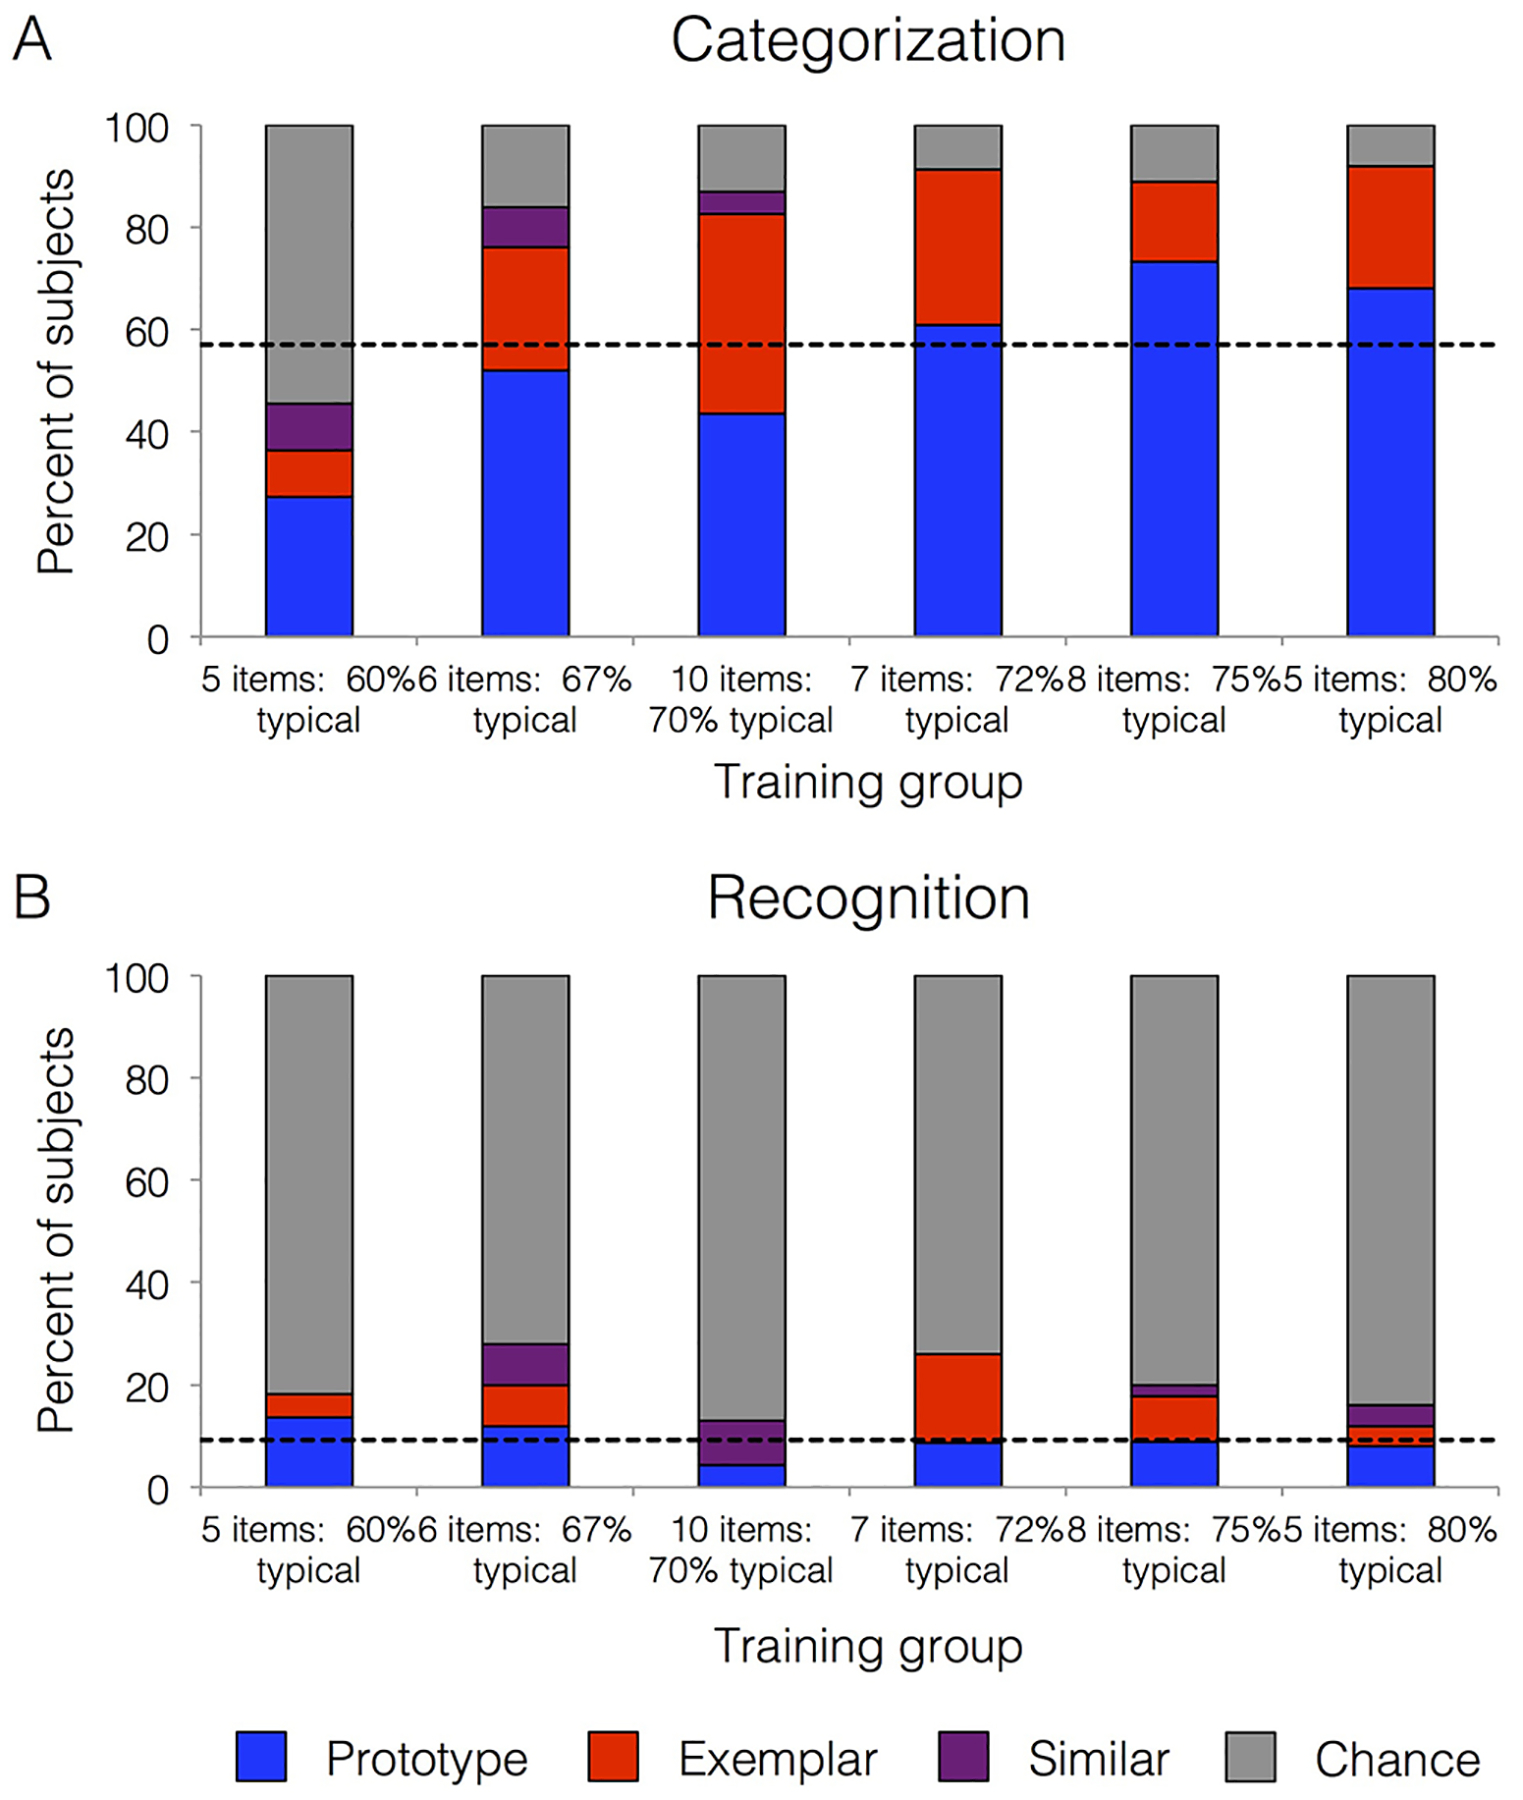
Figure 6.

Model fits. A. Models fit to categorization data and B. recognition data. The percent of subjects better fit by the prototype than exemplar model is depicted in blue, the percent better fit by the exemplar than prototype model in red, the percent who were comparably fit by both models (‘similar’) in purple, and those whose fits did not differ from chance in grey. Both graphs separate results by training group: coherence levels are indicated by the percentages on the x-axis, and training set size is indicated on the x-axis by the number of items per category. The dashed lines depict the percent of subjects best fit by the prototype model across the entire group for each respective test.
