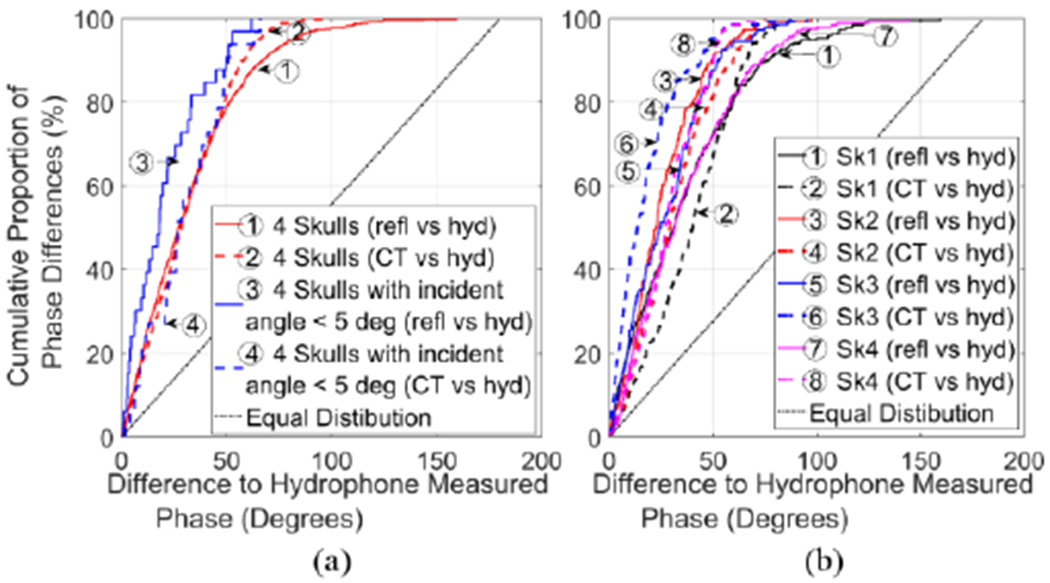
Fig. 5.

Cumulative proportion of the phase differences of the three modalities (solid line: resonance vs. hydrophone method; dashed line: CT-based correction vs. hydrophone method) for all the spots measured. (a).All 4 skulls were represented with red line, the case with incident angle less than 5° with blue line, and (b) skull 1-4 with black, red, blue, and magenta lines, correspondingly. Equal distribution was marked with dotted line. Ideally the graph would be a step function.
