
Figure 5.
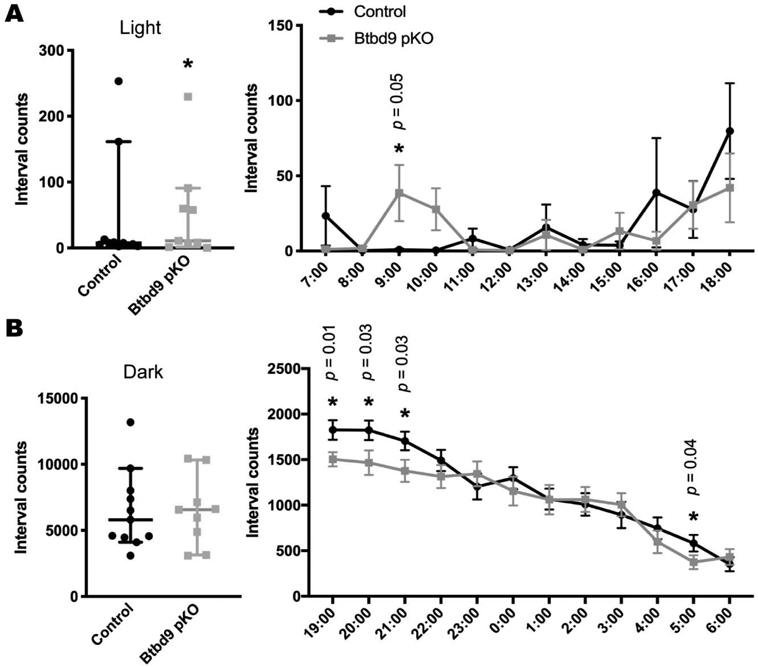
Wheel running test of Btbd9 pKO mice. Btbd9 pKO mice (n=9, 4 periods), compared with the controls (n=11, 4 periods), showed an increased level of activity in the wheel running test specifically during the light phase (A), but not during the dark phase (B). Detailed hourly activities were presented next to the related scatter plots. Scatter plots were presented as median with 95% CIs. Each dot in the scatter plots is an averaged value from 4 periods for each animal. Significant p values are marked above the corresponding time points. *, p ≤ 0.05.