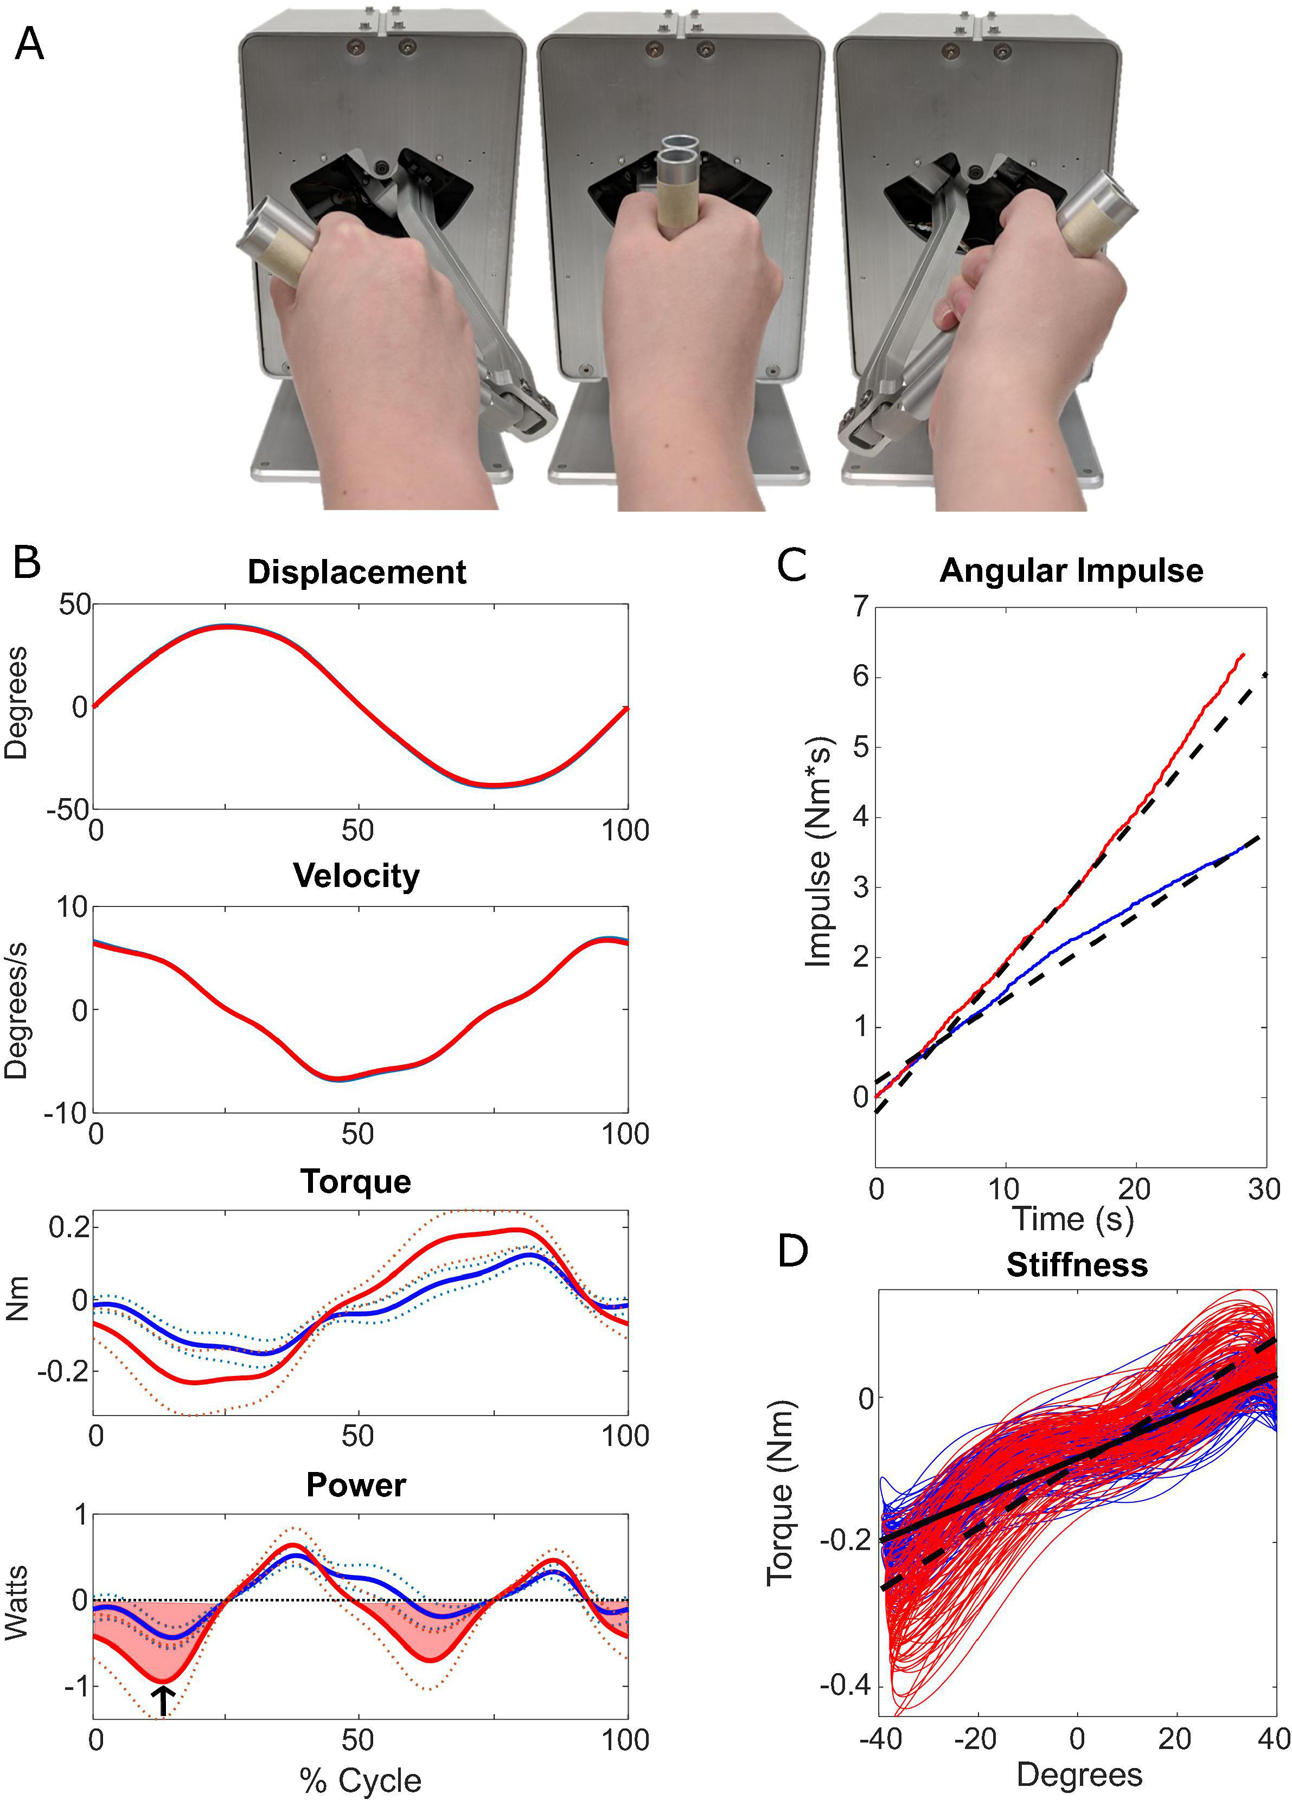
Fig. 2:

Robotic manipulandum and quantitative rigidity metrics from a single subject. A) The robotic manipulandum demonstrating approximate pronation, neutral, and supination positions (left to right, respectively). Participants were instructed to hold the handle as the motor rotated the forearm through ± 40 degrees of pronation-supination. Resistive torque was measured through a strain gage attached to the motor. B-D) Quantitative metrics are shown from two 45 second trials, with higher levels of torque measured during the trial shown in red due to the use of an activation maneuver. B) Plots showing one cycle of displacement and torque, measured from the robotic manipulandum, as well as velocity and power, which are calculated based on the displacement and torque. In the torque and power plots, the solid line shows the mean values with the standard deviation shown by the dotted lines. The shaded region of the power plot represents the negative work measure. The arrow indicates the peak negative power measure for this cycle. C) Red and blue lines show integrated torque over time, or impulse. The 1st order regression lines are indicated by the black dashed lines. The slope of the dashed line was used as a measure of angular impulse. D) The slope versus displacement plots are shown in red and blue. The slope of the 1st order regression lines (solid for blue, dotted for red) gives the measure of stiffness.
