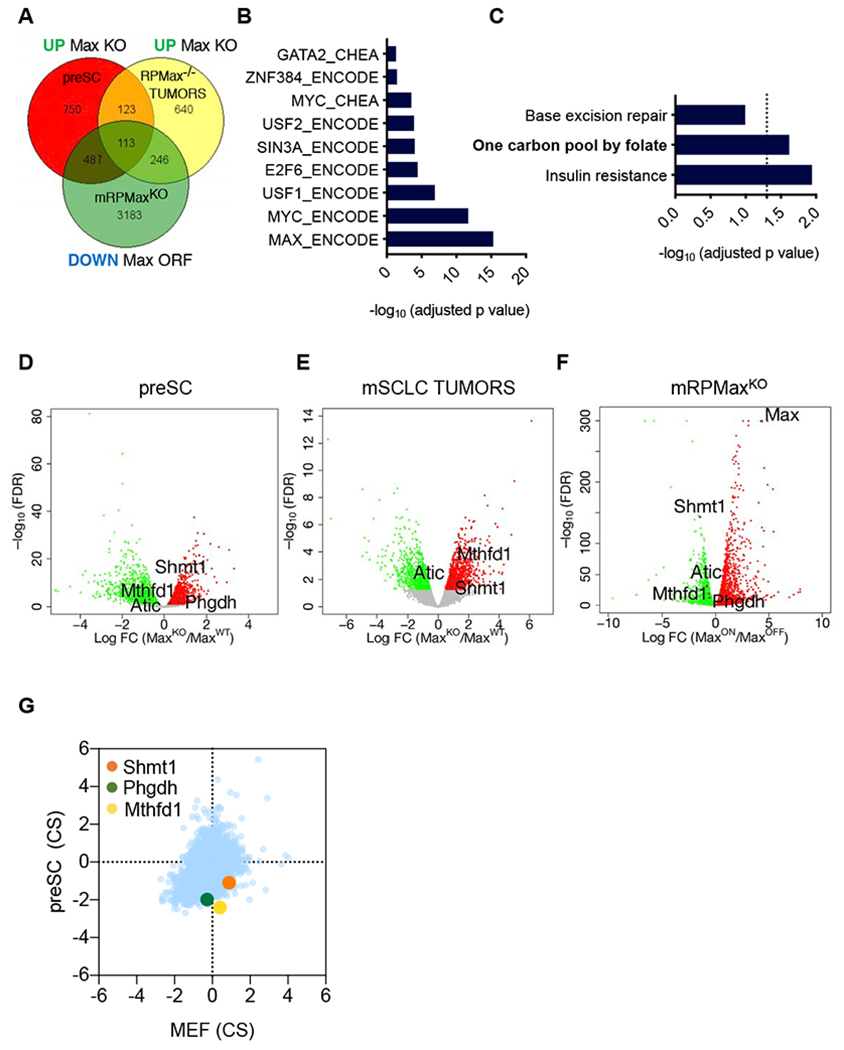
Figure 5. Transcriptional analyses of MAX altered SCLCs.

A, Venn diagram of the upregulated genes upon Max loss in preSCs and mSCLCs tumors and downregulated upon Max restoration in the mRPMaxKO Max-null mSCLC line. The list of genes used to generate the Venn diagram were selected from EdgeR analysis with a cut off of FDR<0.05. B, ENCODE or CHEA binding analysis for the 113 significant genes from (A) shared across the 3 models, upregulated upon Max loss and downregulated upon Max restoration. An adjusted p value of p<0.05 was considered significant. C, KEGG pathway analysis for the 113 genes from (A) shared across the 3 models, upregulated upon Max loss and downregulated upon Max restoration. An adjusted p value of p<0.05 was considered significant. D-F, Volcano plots from the Max-KO vs Max-WT preSC cell comparison (D), Max deleted vs Max control mSCLC tumors (E) and inducible MAX restoration in mRPMaxKO cell line (F) are shown. Significant genes upregulated upon Max perturbation are in red or downregulated in green. An FDR<0.05 was considered significant. Individual genes of interest are depicted. G, CRISPR score plot of the metabolic hits of interest showing increased depletion of guide RNAs targeting these genes in preSCs as compared to MEFs following 12 population doublings. See also Figure S5.
