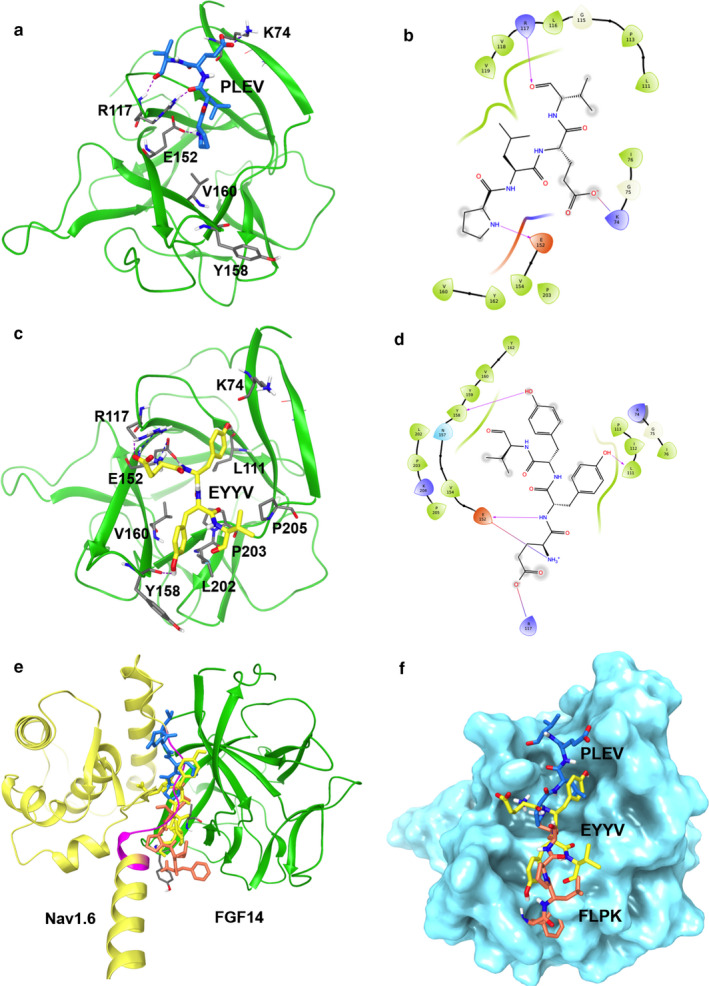
FIGURE 2.

PLEV and EYYV docking to the FGF14:Nav1.6 C‐terminal tail complex. (a) ribbon representation of PLEV (blue) docked into the FGF14 chain of the FGF14:Nav1.6 C‐terminal tail homology model. FGF14 is depicted as green ribbons. Key interaction residues are depicted as gray sticks. H‐bonds are depicted as purple dotted lines, salt bridge is depicted as blue dotted line. (b) interaction diagram of predicted PLEV binding site. Residues shown in map are within 4 Å cut‐off to PLEV. H‐bonds and salt bridges are depicted as purple lines. (c) ribbon presentation of peptide fragment EYYV (yellow) docking into the FGF14 chain of the FGF14.Nav1.6 C‐terminal tail complex homology model. FGF14 is depicted as green ribbons. Key interaction residues are depicted as gray sticks. Hydrogen bonds are depicted as purple dotted lines, salt bridge is depicted as blue dotted line. (d) interaction diagram of predicted EYYV binding site. Residues shown in map are within 4 Å cut‐off to EYYV. H‐bonds and salt bridge are shown in purple. (e) overlay of FLPK (orange), PLEV (blue) and EYYV (yellow) docked poses and FGF14.Nav1.6 C‐terminal tail complex homology model. The FGF14 chain is depicted as green ribbons and Nav1.6 C‐terminal tail is depicted as yellow ribbons. (f) surface presentation of FLPK, PLEV and EYYV docking into FGF14
