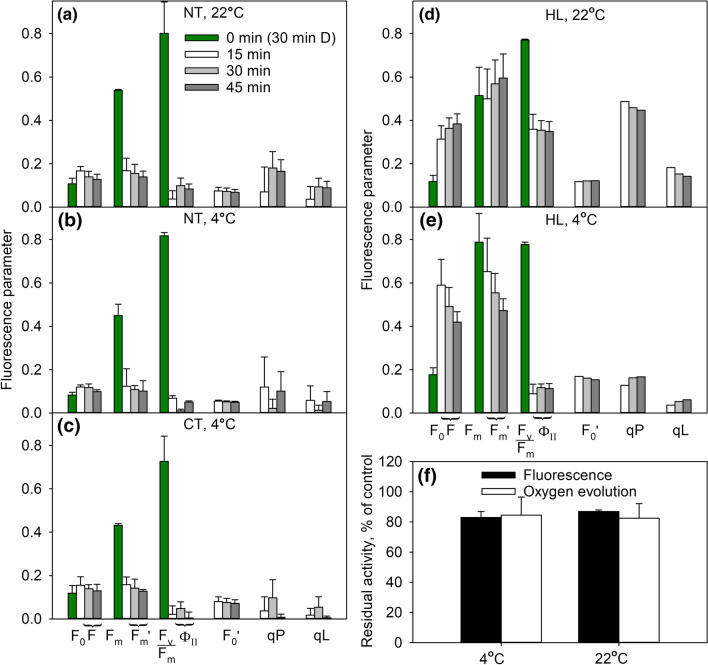
Fig. 8.
Chlorophyll a fluorescence parameters (a–f) and oxygen evolution (f) during 45-min illumination at 22 °C (a, d, f) or at 4 °C (b, c, e, f) measured from detached leaves of non-cold-treated (NT; a, b), cold-treated for 2 weeks (CT; c) or grown in high light at 20 °C (HL; d, e) A. thaliana accession Columbia-0. PPFD was 2000 µmol m−2 s−1 in a–c and 1000 µmol m−2 s−1 in d–f. F0 and Fm were measured after 30 min dark-acclimation [time point 0 min (30 min D)] and all other parameters were measured in the light, 15, 30 or 45 min after switching on the light, as indicated (a–e). F is the fluorescence yield under illumination. Fv/Fm is the maximum quantum yield of PSII electron transfer, calculated as (Fm − F0)/Fm. ɸII is the quantum yield of PSII electron transfer in the light, calculated as (Fm' − F)/Fm'. F0′ is the value of F0 in the light, calculated as 1/(1/F0 − 1/Fm + 1/Fm'). qP and qL are estimates of photochemical quenching; qP is calculated as (Fm' − F)/(Fm' − F0′) and qL as qP × F0′/F. F0, Fm and Fm' values may differ between treatment groups due to different settings of the fluorometer. Occasional below-zero qP or qL values in (a–c) were interpreted as zeros. HL Columbia-0 leaves were incubated overnight with the petioles in lincomycin (d–f), and photoinhibition after the 45-min illumination was quantified by the chlorophyll a fluorescence parameter Fv/Fm from leaves after 30 min in dark and by the light-saturated oxygen evolution of PSII in the presence of an artificial electron acceptor measured from thylakoids isolated from the illuminated leaves (f). The error bars show SD from at least three biological replicates. In d, e F0′, qP and qL have been calculated from averages

