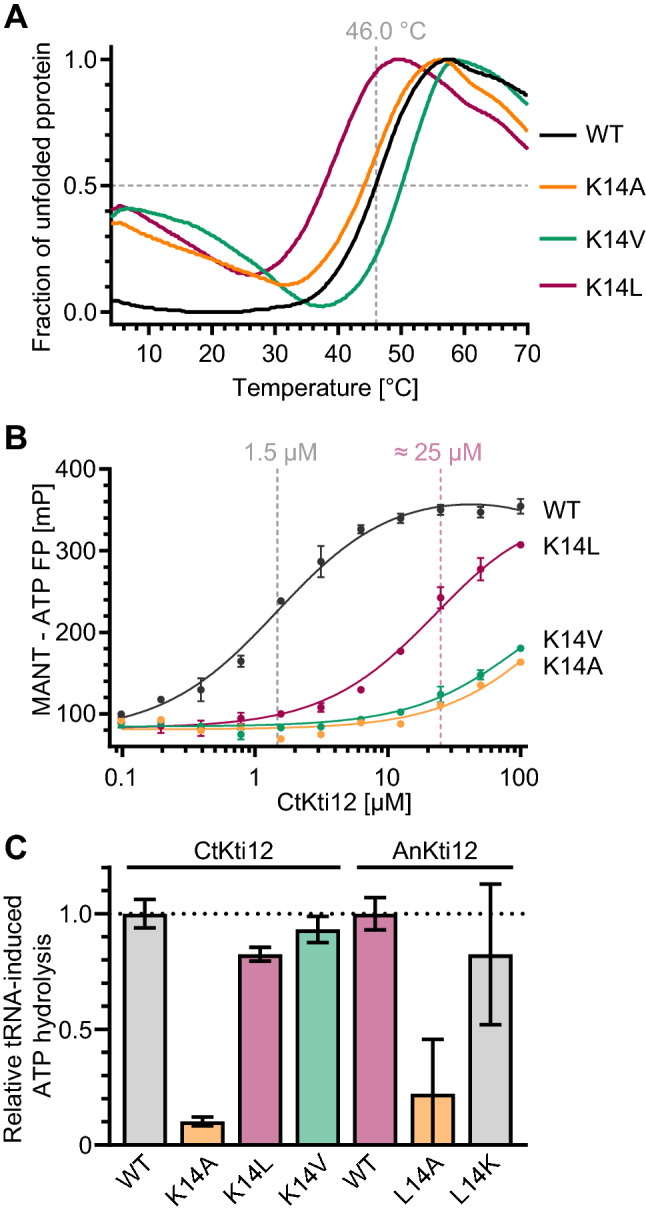
Fig. 3.

Biochemical properties of Kti12 mutants. a Thermostability profiles of CtKti12 K14 point mutants. Thermal shift assay, curves represent an average of three independent experiments. b Fluorescent polarization study of MANT-ATP bound by Kti12 mutants. CtKti12 WT Kd = 1.5 μM ± 0.2 μM, K14L Kd = 25.0 μM ± 2.4 μM. In case of CtKti12 K14A and K14V we were unable to determine Kd in a measured concentration range. c Relative tRNASec-induced ATPase activity of CtKti12 and AnKti12 mutants, compared to the respective WT versions. Free phosphate concentration was measured using malachite green assay. Bars represent an average of three independent experiments ± standard deviation. Proteins carrying different amino acids at position 14 are color coded (K14 grey, A14 orange, L14 purple and V14 green)
