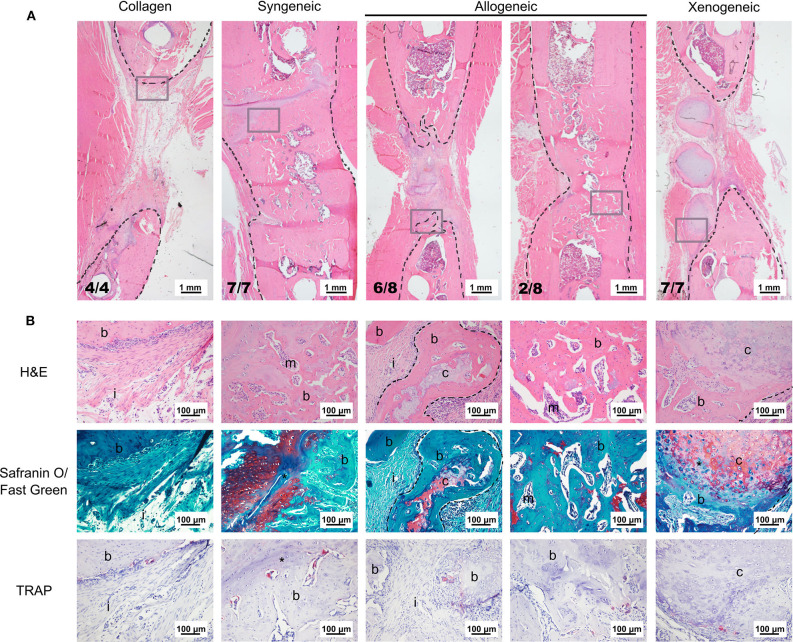
Figure 3.
Representative images of the bone defect repair after 12 weeks. (A) Overview of the defect area stained with H&E. The black dotted lines indicate the bone edges whereas the gray boxes highlight the area depicted in the higher magnification in (B). (B) H&E staining shows that the edges of the cartilaginous spheroids (limited by the dotted line) were converted into bone. Safranin O/fast green staining highlights active EBR in the syngeneic group and the presence of some non-remodeled cartilage (red) in the core of the spheroids of the allogeneic and xenogeneic groups. TRAP staining (bright pink) indicates the presence of active osteoclasts in all groups. i, tissue infiltration; b, bone; m, bone marrow; c, cartilaginous spheroids; *EBR.

