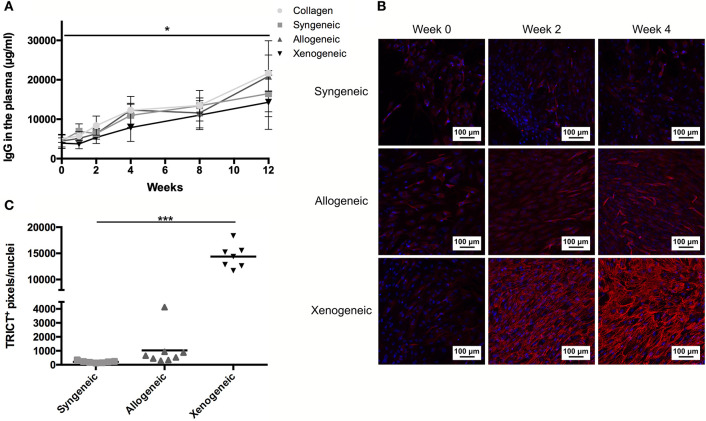
Figure 7.
Humoral response to the non-autologous implants. (A) Systemic IgG quantification shows a significant increase over time for all samples, but no differences between groups at any time-points. (B) Specific anti-donor IgG and IgM (red staining) were observed in all groups, but in particular in the xenogeneic group. (C) Quantification of the fluorescent staining confirmed that significantly more antibodies are produced against the xenogeneic implant. Although not statistically significant, more antibodies are produced on average against the allogeneic implants compared to the syngeneic ones. *p < 0.05 and ***p < 0.001.

