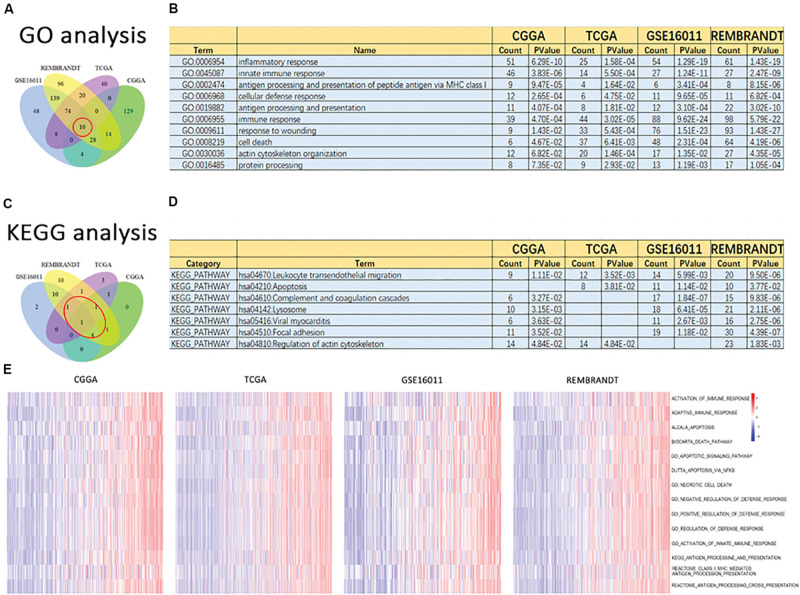
FIGURE 5.
Altered functional characteristics related to the signature of 19 ferroptosis-related genes. Functional annotation of genes positively correlated with the risk score using the GO terms of biological processes, the KEGG pathway, and GSVA in the CGGA, TCGA, GSE16011, and REMBRANDT datasets. (A) Wayne Diagram shows the results of GO analysis in the four datasets. (B) Intersection of GO terms in the four datasets. (C) Wayne Diagram shows the results of KEGG analysis in the four datasets. (D) Intersection of the KEGG pathways in the four datasets. (E) Heatmaps of the GSVA results in different gene sets in the four datasets.

