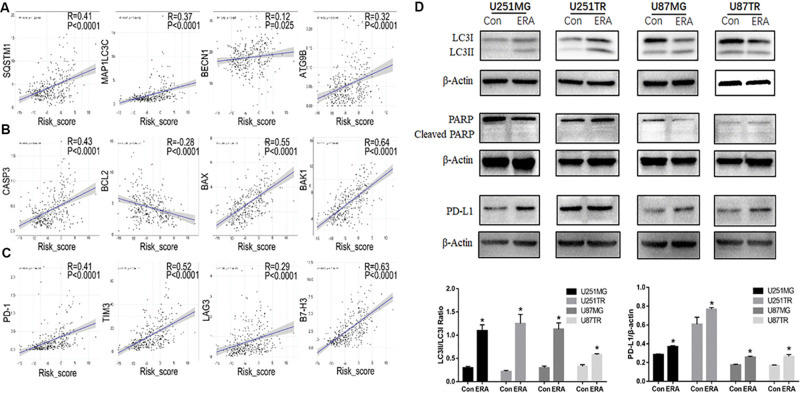
FIGURE 7.
Relationship between risk scores of the ferroptotic signature and autophagy. (A–C) In the CGGA database, correlation analysis of ferroptosis-related gene risk scores and autophagy markers (A, SQSTM1, MAPLC3C, BECN1, and ATG9B), apoptosis markers (B, CASP3, BCL2, BAX, and BAK1), and immune checkpoint markers (C, PD-1, TIM3, LAG3, and B7-H3). (D) Western blot analysis showing the expression levels of LC3 PARP and its cleaved-PARP, and PD-L1 in U251 and U87 glioblastoma cell lines treated with erastin (50 μM for 24 h). Data are presented as mean ± SEM. *P < 0.05 compared with respective controls.

