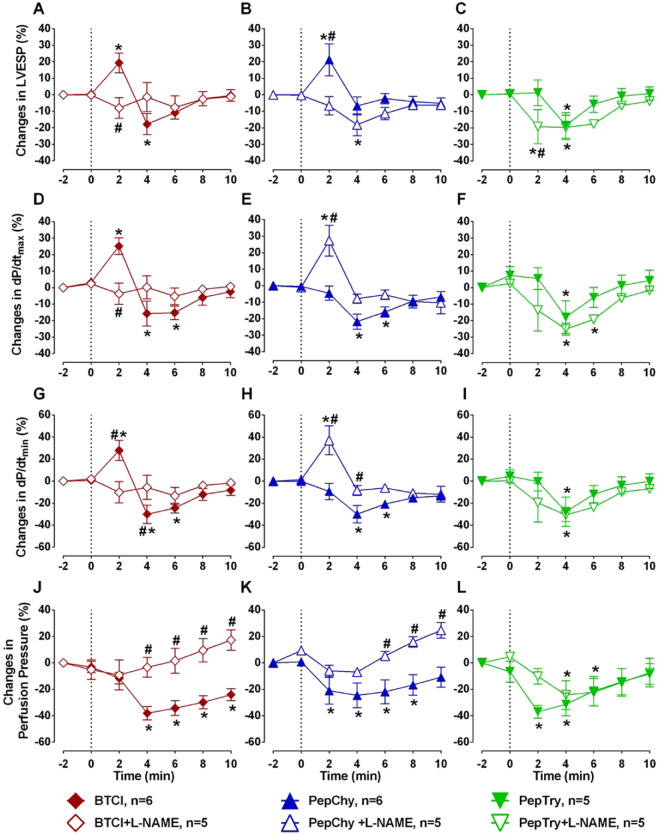
Figure 8.
Effects of BTCI, PepChy and PepTry in isolated rat hearts. Effects of the PepChy, BTCI and PepTry in the (A–C) Left ventricular end-systolic pressure (LVESP), (D–F) Maximal Rate of Left Ventricular Pressure Rise (dP/dtmax), (G–I) Maximal Rate of Left Ventricular Pressure Decline (dP/dtmin), and (J–L) Perfusion Pressure. The dotted line represents the beginning of peptide infusion. Data are reported as mean ± SE. *p < 0.05 vs. baseline, #p < 0.05 vs. between time points. Two-way ANOVA was followed by Sidak’s multiple comparison post-test.

