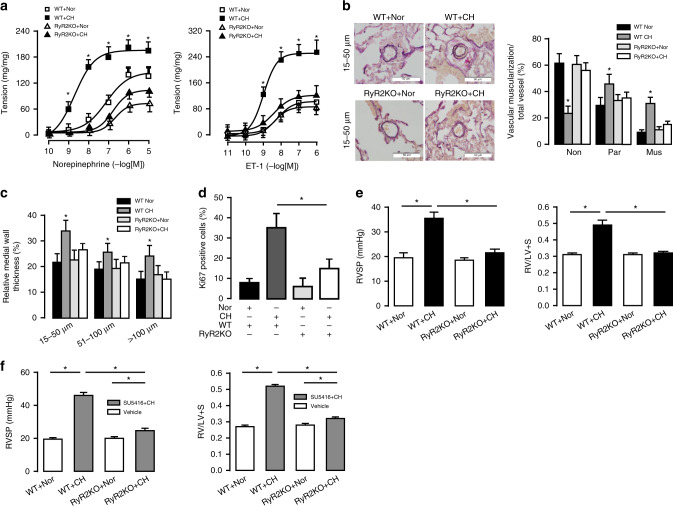
Fig. 2. RyR2 KO mice are resistant to hypoxia-induced pulmonary hypertension.
a Concentration-response curves for norepinephrine and endothelin-1 (ET-1) induced muscle contraction are obtained from normoxic (Nor) and CH PA strips from WT and RyR2 KO mice (n = 4 independent studies, 7 PA strips per study). b Typical lung sections of PAs are demonstrated by using Elastic Van Gieson staining in WT mice (bar scale: 50 µm). Proportion of non-(Non), partially (Par), or fully (Mus) muscularized PAs in total counted PAs. A total of 50–60 intra-acinar vessels are analyzed in each mouse, and 5–7 mice have been grouped (n = 5 independent studies, 50 vessels per study). c Relative medial wall thickness of PAs sized 15–50 μm, 51–100 μm, and over 100μm in relation to cross-sectional diameter (n = 5 independent studies, 50 vessels per study). d PASMC proliferation (Ki-67 staining) in vivo after CH. The degree of cell proliferation is expressed as the percentage of Ki-67-labeled cells over the total number of cells counted in the media layer of at least 20 muscularized vessels per mouse (n = 5 independent studies, 50 vessels per study). e Summarized the effect of chronic hypoxia (CH) on the right ventricular systolic pressure (RVSP) in WT and RyR2 KO PH mice model measured by 1.2 F catheter. Ratio of right ventricle (RV) to left ventricle (LV) plus septum (S) weight (RV/LV + S) to measure RV hypertrophy (n = 6 independent studies, 5 mice per study). f Effect of SU5416 subcutaneously once weekly (20 mg/kg) or vehicle followed by CH on WT RVSP and RV/LV + S (n = 5 independent studies, 5 mice per study). Data are expressed as mean ± standard error. (*P < 0.05, using one-way ANOVA test).

