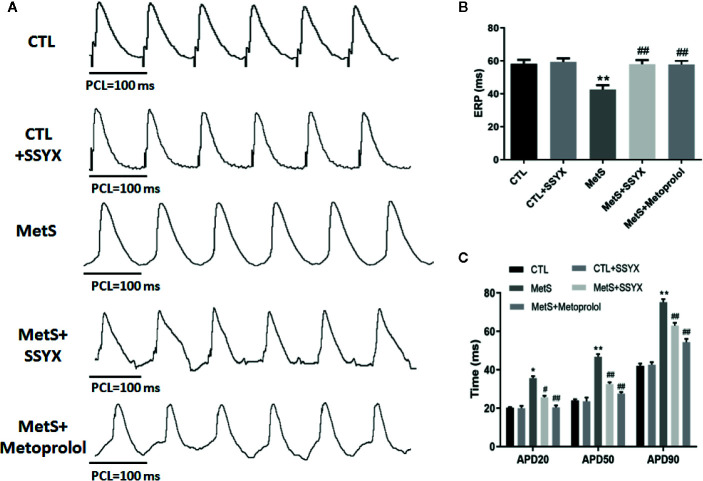
Figure 3.
Effects of SSYX administration on the electrophysiological properties in MetS rats (A) Representative examples of APD. (B) Statistical analysis of ERP and (C) APD in the five groups (n = 10 per group). *P < 0.05 vs. CTL group. **P < 0.01 vs. CTL group. # P < 0.05 vs. MetS group. ## P < 0.01 vs. MetS group.

