Figure 1.
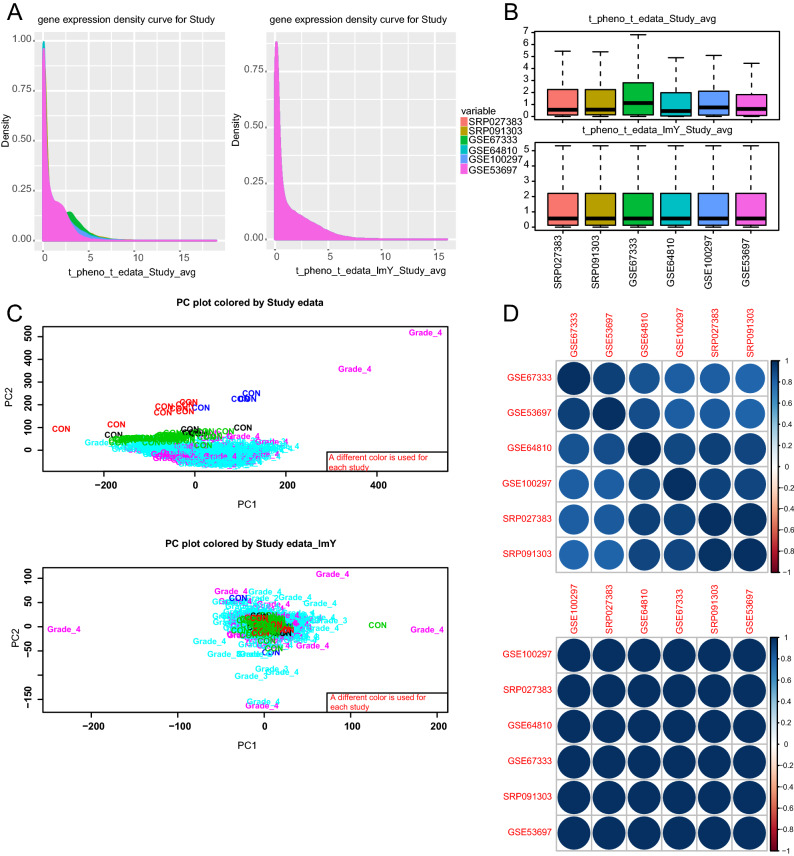
Effect of SVA + LM adjustment on Glioblastoma (SRP027383, SRP091303) and control brain (GSE67333, GSE64810, GSE100297, GSE53697) RNA-seq studies. (A) Density plot representation of gene expression per study before and after SVA + LM adjustment (B) Box and whisker plot representation of gene expression per study before and after SVA + LM adjustment. (C) Principal component (PC) projections of datasets before and after SVA + LM adjustment. (D) Pearson correlation plot of the studies before and after SVA + LM adjustment.

