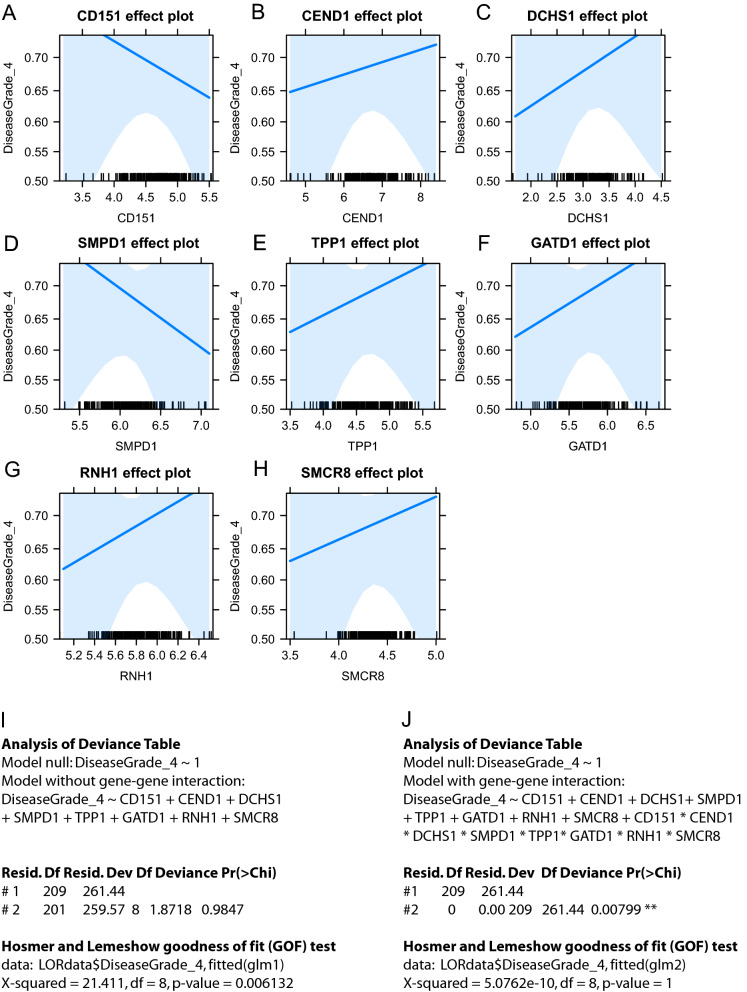
Figure 5.
Logistic regression model for prediction of Glioblastoma using QNPbyTAP genes that are atleast 20-fold-upregulated in QNP relative to TAP and are significantly enriched in in Glioblastoma HuAgeGBsplit_18 WGCNA module. Effects plot showing probability of Glioblastoma (DiseaseGrade_4) with change in expression of CD151 (A), CEND1 (B), DCHS1 (C), SMPD1 (D), TPP1 (E), GATD1 (F), RNH1 (G) and SMCR8 (H). Chi-square test and Hosmer and Lemeshow goodness of fit (GOF) test for logistic regression model without gene–gene interaction (I) and with gene–gene interaction (J).

