Figure 5.
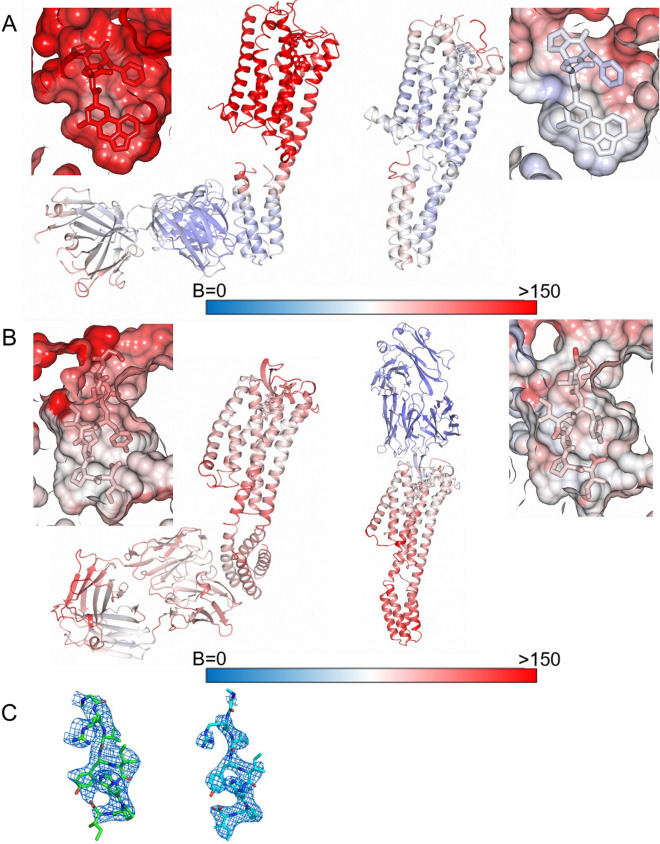
B-factor analysis and comparison of the ligand electron density maps. (A) B-factor analysis for 5HT1B/ERG/SRP2070Fab (left) and 5HT1B/ERG (PDB ID: 4IAR) (right). Both the overall structure and the area around ligand are shown. (B) B-factor analysis for AT2R-BRIL/s-Ang II/SRP2070Fab (left) and AT2R/s-Ang II (PDB ID: 5XJM) (right). Both the overall structure and the area around ligand are shown. (C) The ligand electron density map of AT2R-BRIL/s-Ang II/SRP2070Fab (left) and AT2R/s-AngII (PDB ID: 5XJM) (right). The omitted mFo–DFc electron density map contoured at 3.0 σ (Polder map).

