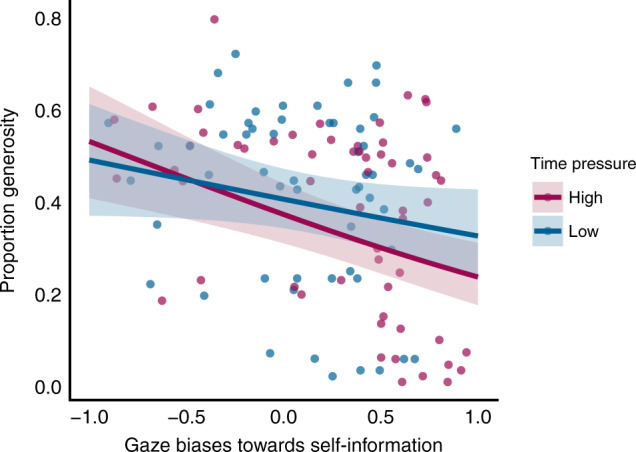
Fig. 4. Time pressure moderates gaze-biases’ effects on generosity.

Each point represents a single subject (N = 57), coloured by time pressure condition. Solid lines represent the predicted group averages extracted from the general linear model. Shaded regions represent the 95% confidence interval of the predicted values centred at the predicted group mean, coloured by time pressure condition. Source data are provided as a Source Data file.
