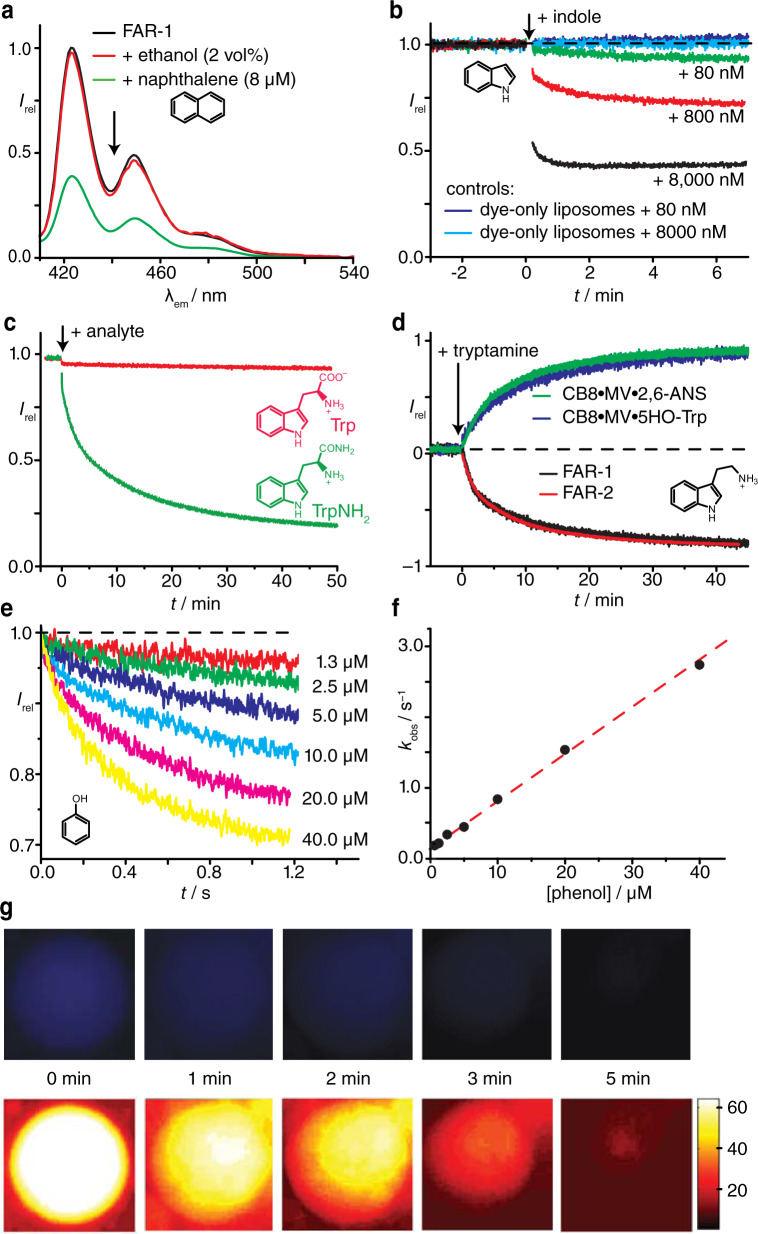
Fig. 3. Temporally and spatially resolved FARMA experiments.
a Emission spectra of FAR-1-loaded liposomes prior and after addition of naphthalene (ethanolic stock); addition of neat ethanol is shown as the control. b Emission intensity of FAR-2-loaded liposomes upon addition of indole (aq. stock); control exp. with D1-loaded liposomes are shown in blue. c Time-resolved translocation monitoring of tryptophan (Trp) and tryptophanamide (TrpNH2), both 8 µM from aq. stock, with FAR-1-loaded liposomes (POPC : POPS 8 : 1, 10 mM HEPES buffer, 22 °C). d Translocation monitoring of tryptamine (aq. stock, 16 µM) with FAR-1- and FAR-2-loaded liposomes, and with two membrane-encapsulated indicator displacement ensembles (blue and green, see Supplementary Information). Experiments were conducted with POPC : POPS 8 : 1 liposomes in 10 mM HEPES buffer at 22 °C. e, f Kinetic traces from stopped-flow experiments for rapid mixing (1 : 1 v/v) of phenol (aq. stock) with FAR-2-loaded liposomes (POPC : POPS 8 : 1, 10 mM HEPES buffer, 22 °C). f Plot of kobs, from monoexponential fits of kinetic traces vs. phenol concentration. g Time series of fluorescence microscopy images of a FAR-1-loaded GUV after addition of 5 µL tryptophan methyl ester (TrpOMe, 800 µM stock) to the medium, as real-color images (top) and as intensity-coded images (bottom). Experiments were conducted with POPC : POPS (15 : 1) liposomes at 22 °C.

