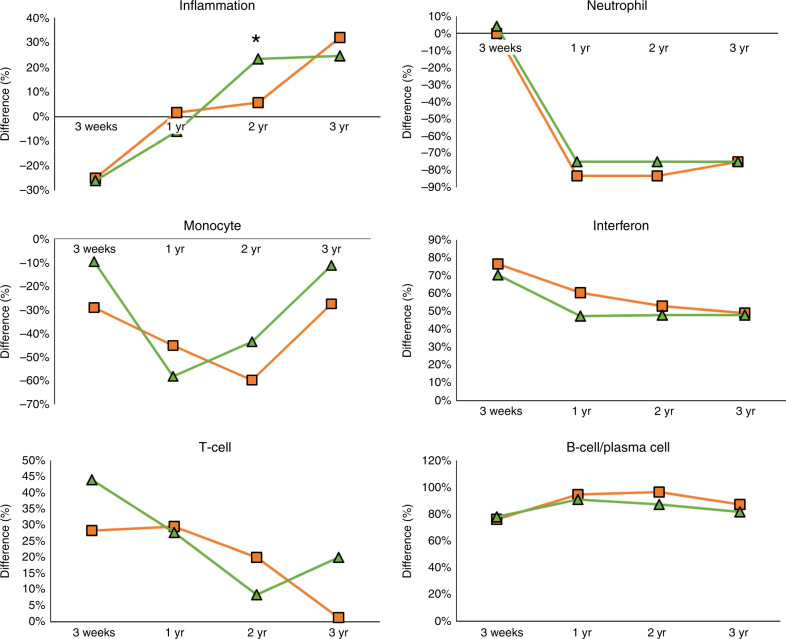
Fig. 6. Longitudinal modular analyses of infants with cCMV infection.
Mean percent difference* in modular expression of innate (inflammation, neutrophil, monocytes, interferon) and adaptive immunity (T cell and B cell/plasma cell) modules are plotted and compared over time (baseline, 1 year, 2 years, and 3 years of age) for infants with symptomatic (orange square) and asymptomatic (green diamond) congenital CMV infection. *The mean percent difference was calculated by the percentage of genes upregulated (positive percent) minus the percentage of downregulated genes (negative percent) within each module. When the biological functions were represented by more than one module (i.e., interferon, inflammation, T cells, see Fig. 3), modular mean was derived and the percentage difference calculated as explained above.

