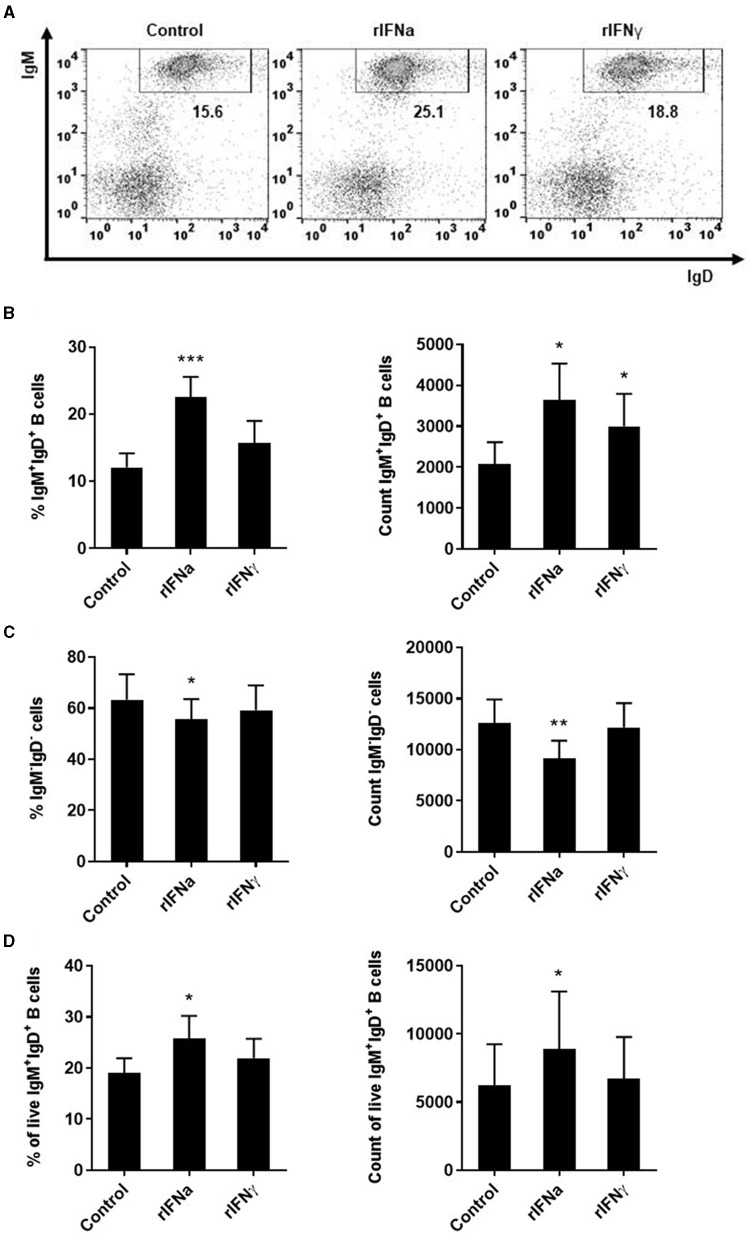
Figure 1.
Survival of blood IgM+IgD+ B cells in response to type I and type II IFNs. PBLs were stimulated with 50 ng/ml rIFNa, 20 ng/ml rIFNγ or media alone (control) and cultured at 20°C for 72 h. Leukocytes were then labeled with specific monoclonal antibodies against trout IgM and IgD and analyzed by flow cytometry. Cells were gated on the basis of their FSC and SSC and percentages of IgM+IgD+ cells determined on singlet and live (DAPI negative) cells. Representative dot plots from one individual fish are shown (A) along with mean percentages and total number of cells detected for IgM+IgD+ B cells (B) and IgM−IgD− cells (C) (mean + SEM; n = 9). In an independent experiment, B cells were sorted from blood leukocytes using a biotinyilated Fab fragment of anti-IgM 1.14 and then incubated with the rIFNs as described above. After 72 h, the percentage of live IgM+IgD+ B cells and the total number of live IgM+IgD+ B cells determined by flow cytometry as described in the Materials and Methods section (mean + SEM; n = 7) (D). Asterisks denote significant differences between samples treated with rIFNs and control samples (*P ≤ 0.05, **P ≤ 0.01, ***P ≤ 0.001).

