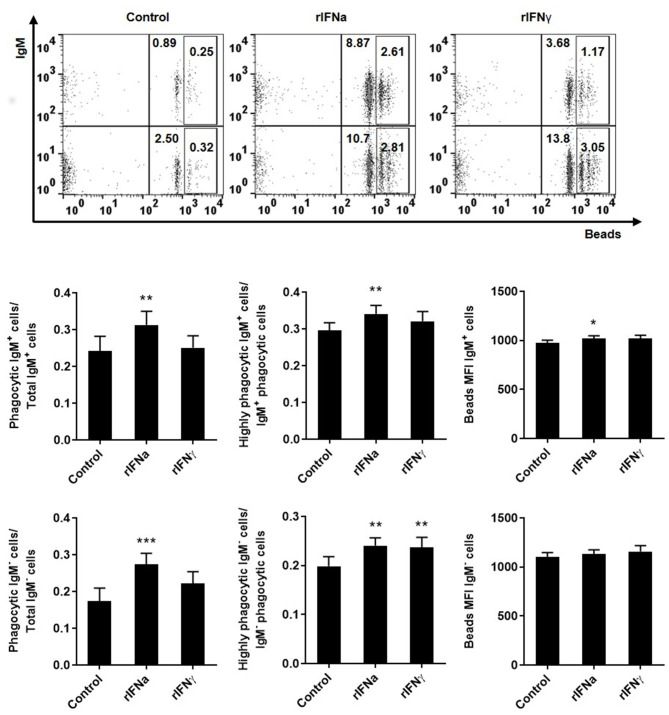
Figure 4.
Effect of type I and type II IFNs on the phagocytic capacity of blood IgM+IgD+ B cells. PBLs were incubated for 72 h at 20°C with 50 ng/ml rIFNa, 20 ng/ml rIFNγ or media alone (control). After this time, cells were incubated with crimson red fluorescent beads (1 μm diameter) at a ratio of 1:10 (cells/ beads) for a further 3 h at 20°C and the phagocytic capacity of B cells established as described in materials and methods. Representative dot plots for each experimental condition are shown. The rectangular areas contain the highly phagocytic cell subpopulations (cells that have internalized a higher number of beads) among IgM+ (upper) or IgM− (lower) cell sub-populations. Upper graphs show the percentage of phagocytic IgM+ B cells within the total IgM+ B cell population (left), the percentage of highly IgM+ phagocytic cells within the total phagocytic IgM+ B cell population (middle) and the mean fluorescence intensity (MFI) of internalized beads within phagocytic IgM+ B cells (right). Lower graphs show the same information for the IgM− population. Data are means + SEM; n = 10. Asterisks denote significant differences between samples treated with rIFNs and control samples (*P ≤ 0.05, **P ≤ 0.01, ***P ≤ 0.001).

