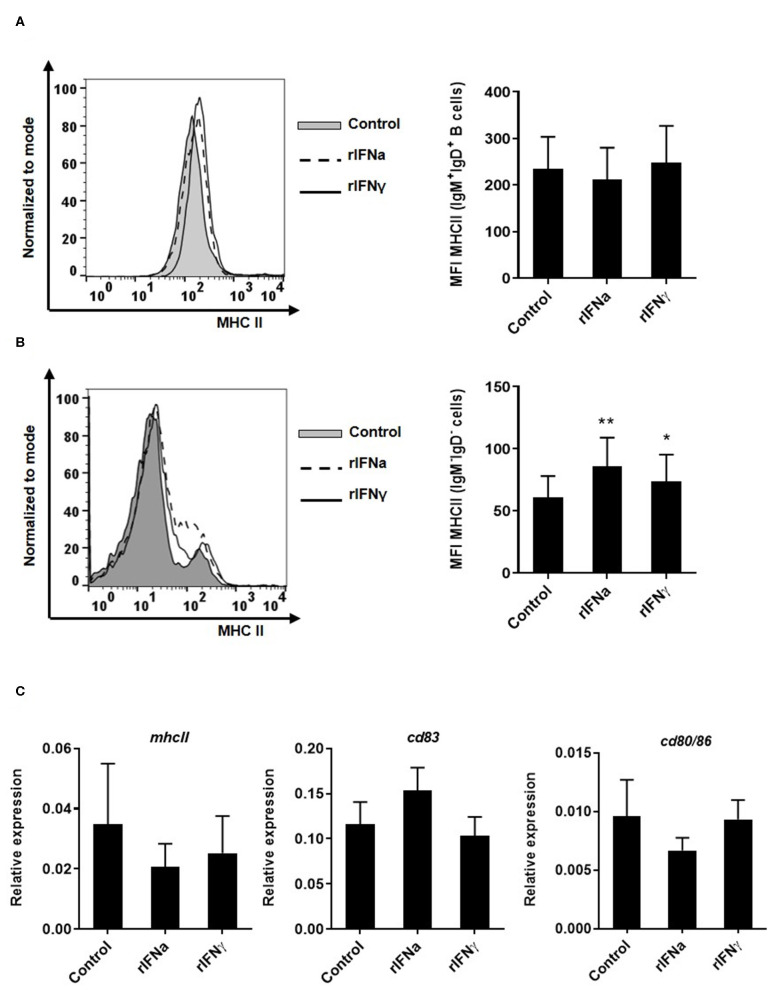
Figure 6.
Effect of type I and type II IFNs on the antigen-presenting capacities of blood cells. PBLs were incubated with 50 ng/ml rIFNa, 20 ng/ml rIFNγ or media alone (control) for 72 h at 20°C. The level of MHC-II surface expression on IgM+IgD+ B cells and IgM−IgD− cells was then measured via flow cytometry using a specific mAb against trout MHC-II. A representative histogram is shown together with a graph of the mean MHC-II MFI values for IgM+IgD+ B cells (A) or IgM−IgD− cells (B) (mean + SEM; n = 9). In another experiment, blood leukocytes were treated with the rIFNs as described above and after 24 h IgM+IgD+ B cells were sorted by flow cytometry. RNA was extracted to determine the levels of transcription of mhcII, cd83, and cd80/86 (C) by real time PCR. Gene expression data were normalized against the endogenous control b-actin and are shown as relative expression (mean + SEM; n = 10). Asterisks denote significant differences between samples treated with rIFNs and control samples (*P ≤ 0.05 and **P ≤ 0.01).

