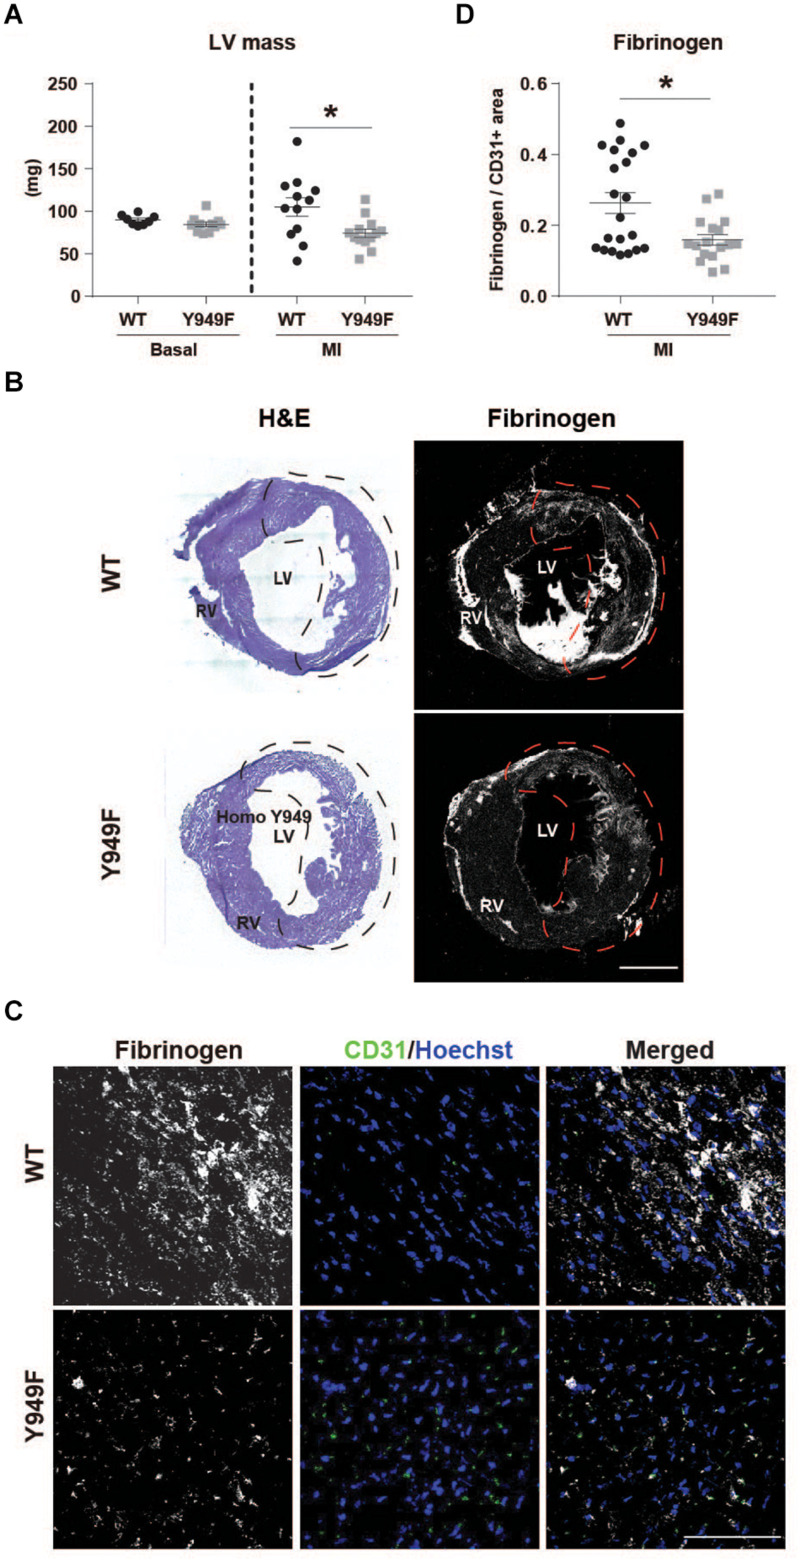
FIGURE 2.
Reduced edema and fibrinogen leakage in Vegfr2Y949F/Y949F MI hearts. (A) Left ventricular (LV) wall mass (mg) in WT and Vegfr2Y949F/Y949F hearts at baseline condition (n = 8–11 mice/strain) and 24 h after MI (n = 12–13 mice/strain). Mann–Whitney test, *p < 0.05. (B) Hematoxylin/Eosin (H&E) and fibrinogen immunofluorescent staining on total WT (top) or Y949F (bottom) heart sections. Scale bar, 1500 μm. The infarct area detected using echocardiography, is indicated by stippled lines in black or red. (C) Fibrinogen (gray) and CD31 (green) immunofluorescent staining of WT and Vegfr2Y949F/Y949F hearts at 3 days after MI; sections from the infarcted area. Scale bar, 100 μm. Hoechst (blue) shows nuclei. (D) Quantification of fibrinogen area normalized to CD31 area in randomly selected regions in total WT and Vegfr2Y949F/Y949F hearts at 3 days after MI (n = 17–21 fields/section from 6 to 7 individual hearts/strain and 2–3 sections/heart). Mann–Whitney test, *p < 0.05. For all panels, n refers to biological replicates.

