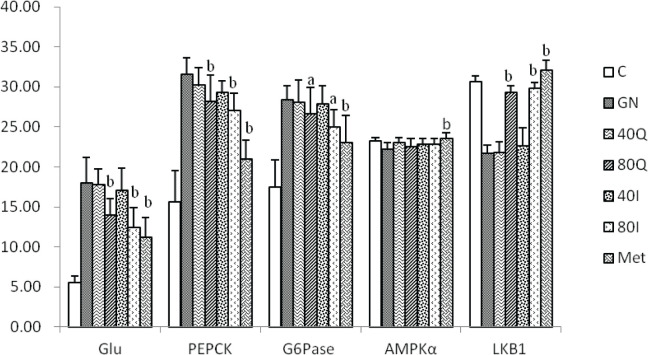
Table 1.
Comparison of glucose production and expressions of PEPCK and G6Pase (x̄ , n = 8)
| Glucose production (μmol/L) | PEPCK (/GADPH) | G6Pase (/GADPH) | AMPKα (/GADPH) | LKB1 (/GADPH) | |
|---|---|---|---|---|---|
| C | 55.17±8.03 | 15.66±3.91 | 17.44±3.40 | 23.25±0.40 | 30.63±0.73 |
| GN | 179.50±31.85 | 31.53±2.13 | 28.41±1.68 | 22.20±0.86 | 21.71±1.05 |
| 40Q | 177.33±20.07 | 30.27±2.17 | 28.09±2.79 | 23.06±0.59 | 21.75±1.38 |
| 80Q | 139.50±21.29b | 28.21±3.21 b | 26.58±3.31 a | 22.52±0.99 | 29.29±0.82b |
| 40I | 170.75±27.29 | 29.34±1.37 | 27.87±2.24 | 22.85±0.65 | 22.58±2.33 |
| 80I | 124.62±24.33b | 27.07±2.13b | 24.94±2.23a | 22.83±0.75 | 29.81±0.75b |
| Met | 111.50±25.42b | 21.00±2.30b | 23.05±3.40b | 23.58±0.68b | 32.04±1.23b |
Note: Compared with group GN, a, P <0.05; b, P <0.01.

