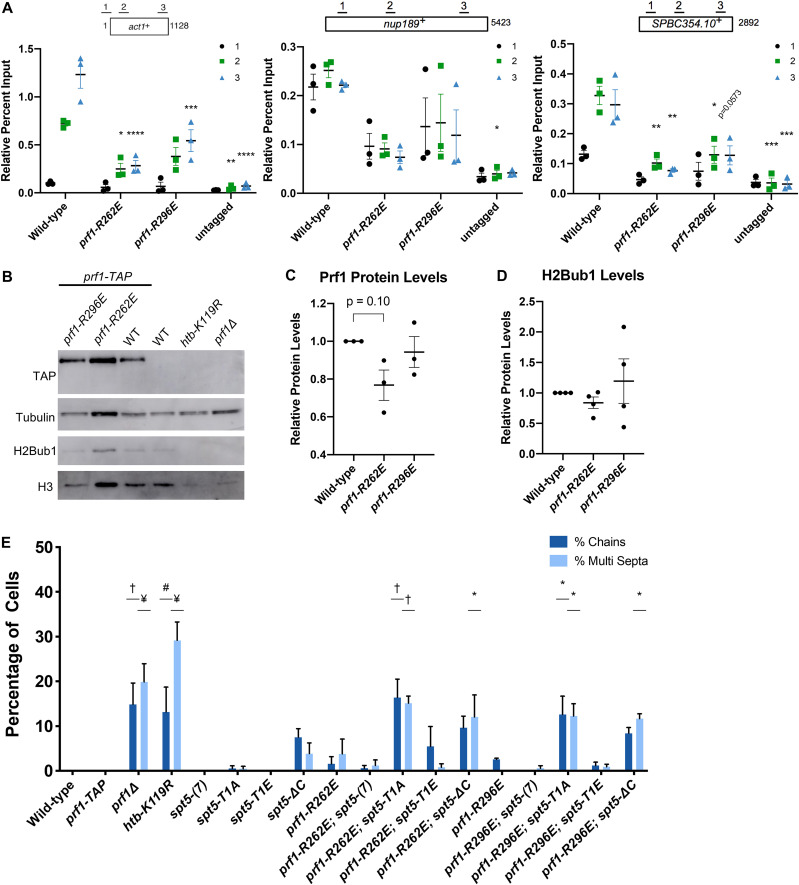
FIG 7.
Disruptions of Plus3 domain nucleic acid binding and pSpt5 binding have similar phenotypic outcomes. (A) TAP tag ChIP was performed on the indicated strains and quantified by qPCR using the indicated primers in act1+, nup189+, and spb354+. Percent IP values were normalized using a primer pair in the S. cerevisiae PMA1 gene. The length of the gene (in base pairs) and positions of PCR amplicons are shown in the diagram at the top. Error bars denote standard errors of the means from 3 independent experiments. Two-way ANOVA was conducted followed by two-sided t tests with Bonferroni correction between each strain and the wild type within a specific primer pair. *, P ≤ 0.05; **, P ≤ 0.01; ***, P ≤ 0.001; ****, P ≤ 0.0001. (B) Immunoblots of whole-cell extracts from the indicated strains. Controls on each blot are the wild-type prf1-TAP strain (left) and an untagged strain (right). Antibodies are indicated on the left. (C) Quantification of immunoblots analyzing Prf1-TAP protein levels normalized to tubulin and then the wild type of the indicated strains. (D) Quantifications of H2Bub1 levels normalized to total H3 levels and then the wild type of the indicated strains. For panels C and D, error bars denote standard errors of the means from 3 independent experiments. A one-sample two-sided t test was conducted between each strain and its relative normalized wild type. (E) Quantification of septation defects in the indicated strains normalized to the number of septated cells counted in each indicated strain. At least 100 cells were counted for each strain per experiment. Error bars denote standard errors of the means from 3 independent experiments. One-way ANOVA was conducted across all strains followed by two-sided t tests with Bonferroni correction between each strain and the wild-type prf1-TAP strain, for each specific morphology defect. *, P ≤ 0.05; #, P ≤ 0.01; †, P ≤ 0.001; ¥, P ≤ 0.0001.

