
Figure 2. Measuring effect of protease-activated receptor 1 (PAR1) inhibitors on endothelial barrier function of EA.hy926 cells using trans endothelial electrical resistance.
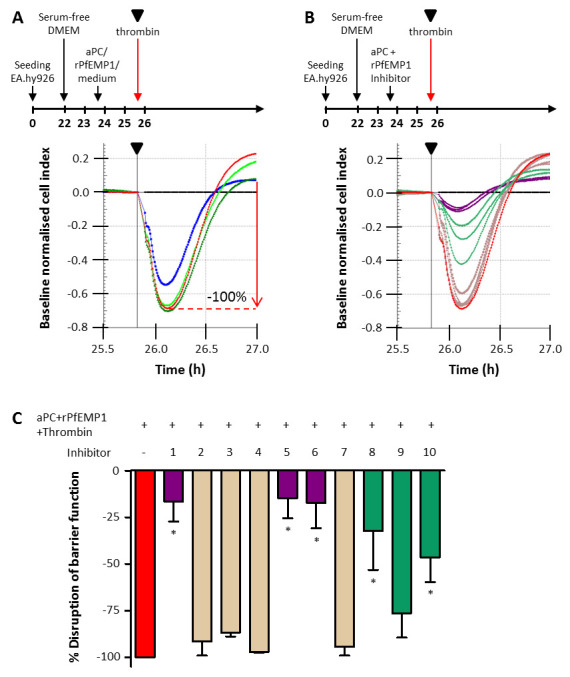
( A) Experimental timeline and cell index traces for thrombin induced decrease in barrier function in EA.hy926 cells. Schematic of the experimental timeline (not to scale) indicating the addition of medium and modulators to the cells. Cell index was normalised at the time point immediately prior to the addition of 2 nM thrombin, indicated by the black triangle in the timeline and cell index trace, and medium (black line) was set as baseline. The decrease in normalised cell index by thrombin (red) was set at 100% and the effect of 57 nM aPC (blue), 25 nM recombinant P. falciparum erythrocyte membrane protein 1 (rPfEMP1) (bright green) and 57 nM activated protein C (aPC) and 25 nM rPfEMP1 combined (dark green) on thrombin induced decrease in barrier function was determined. ( B) The effect of inhibitors on thrombin induced decrease in barrier function. Inhibitors (concentrations in Table 1) were tested in the presence of 57 nM aPC and 25 nM rPfEMP1. The inhibitors in light brown do not have an effect, the inhibitors in light green have and intermediate effect and the inhibitors in purple reverse the effect of thrombin. ( C) Graph of the data depicted in B with corresponding colours. Thrombin induced decrease in barrier function was set as 100% (red) and shown are the mean ± SD of 3 independent experiments for the 10 inhibitors. *denotes a P-value <0.05.