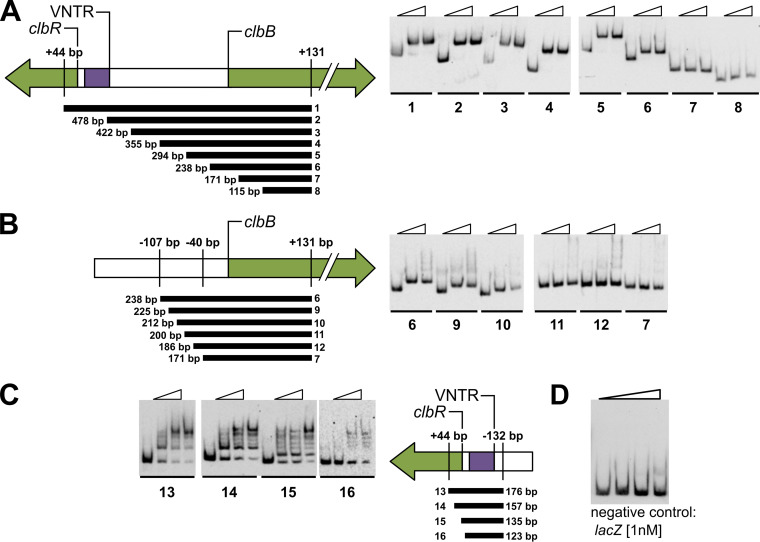
FIG 5.
ClbR binds to clbR and clbB upstream regions. To demonstrate ClbR-DNA interactions using EMSA, PCR-generated, digoxigenin-labeled DNA fragments (300 pM) obtained from the upstream region of clbR and clbB, respectively, were incubated with increasing amounts of purified ClbR protein (for probes 1 to 12, 0 nM, 50 nM, or 100 nM ClbR per lane; for probes 13 to 16, 0 nM, 50 nM, 100 nM, or 150 nM ClbR per lane). The size and position of each of the probes are given relative to the translational start of clbR and clbB, respectively. (A to C) Probes 1 to 12 were used to narrow down the ClbR binding site upstream of clbB (A and B), and probes 13 to 16 were used to analyze ClbR binding to the clbR upstream region (C). Panels A and B refer to different subsets of probes tested for the clbB promoter region. (D) To confirm specific binding of ClbR, a negative control, i.e., a promoter fragment that lacks the ClbR binding motif, was included. For this purpose, a lacZ promoter-based probe [1 nM] was incubated with increasing amounts of purified ClbR protein (0 nM, 50 nM, 100 nM, and 200 nM ClbR per lane). The use of ClbR concentrations at which clear shifts were observed with probes representing the clbR or clbB promoter regions did not lead to reduced migration behavior of the lacZ probe.

