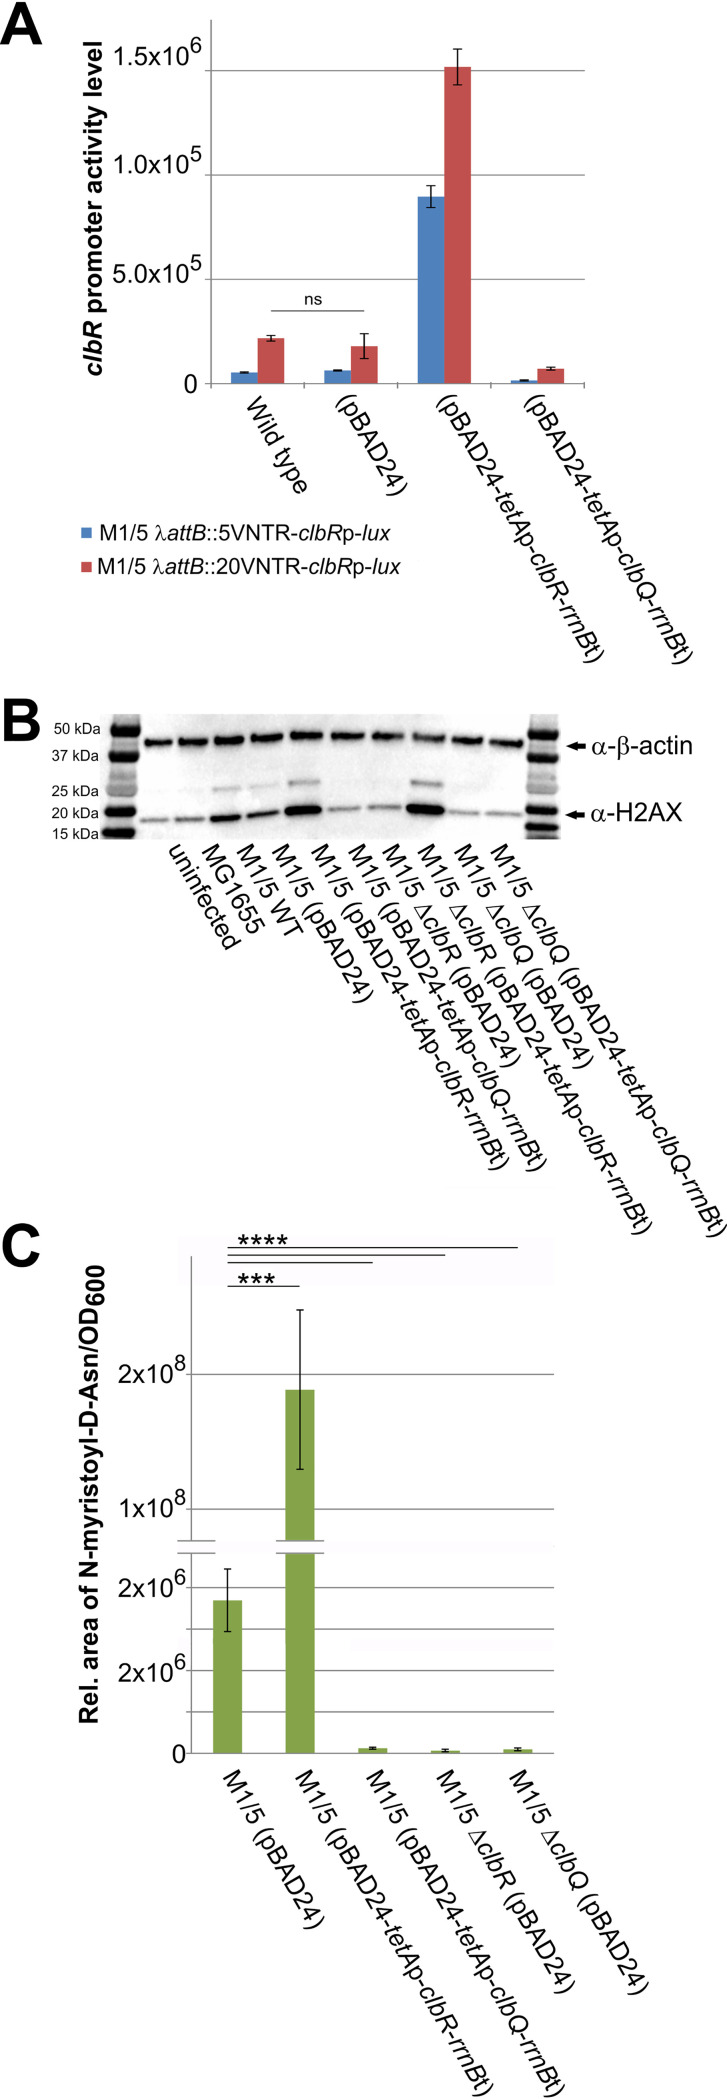
FIG 8.
ClbR and ClbQ levels alter colibactin-mediated phenotype in cell culture assays. The impact of ClbR and ClbQ on clbR expression and colibactin production was tested. (A) E. coli strain M1/5 rpsLK42R carrying a chromosomally λ-attB site-inserted clbR promoter-luciferase fusion that included either a 5-repeat or 20-repeat VNTR region was transformed with pBAD24 derivatives, enabling overexpression of clbR or clbQ. Luminescence as a measure of clbR promoter activity was quantified in response to increased expression of clbR and clbQ. Data are based on results from three biological replicates performed with three technical replicates. Means with standard deviations are shown. Except for E. coli M1/5 rpsLK42R with and without the vector control, the clbR promoter activities measured differed significantly in response to clbR and clbQ overexpression (P > 0.0001, unpaired t test). (B) HeLa cells were either infected with E. coli strain M1/5 rpsLK42R or derivatives (MOI of 200) or not infected. At 4 h postinfection, bacteria were removed and the cells were cultivated for another 4 h and subsequently washed with PBS and lysed. A total of 6 μg protein per lane of the indicated samples was analyzed by SDS-PAGE and afterwards transferred onto a PVDF membrane. γ-H2AX was detected using anti-gammaH2A.X (phospho S139) antibody (Abcam). β-Actin served as a loading control. Corresponding bands are marked with an arrow. For colibactin-producing strains, the ubiquitinylated band (∼25 kDa) could also be detected. (C) The impact of ClbR and ClbQ on colibactin production of M1/5 rpsLK42R was also analyzed by UPLC-HRMS-based comparison of N-myristoyl-d-asparagine levels. The data presented in the graph were obtained from three biological replicates. Mean values with standard deviations are shown. ****, P < 0.0001; ***, P < 0.001 (unpaired t test).

