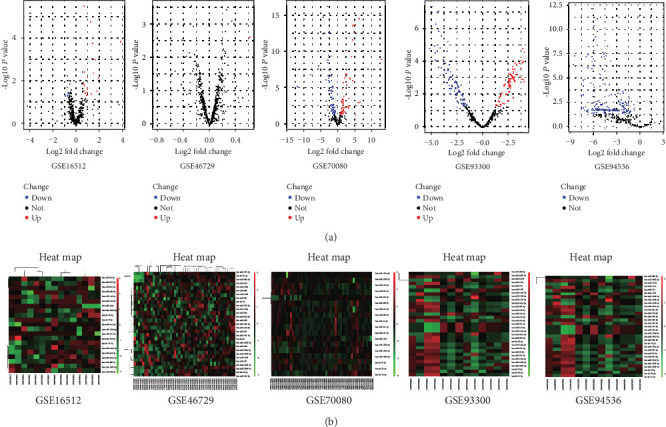
Figure 2.

Data analysis of 5 GEO chips. (a) Volcano plots of the different miRNA expression analysis. x-axis: log 2 fold change; y-axis: -log10 p-value for each probes. (b) Two-dimensional hierarchical clustering of 27 DEmiRNA s in all samples. MiRNAs are in rows; samples are in columns.
