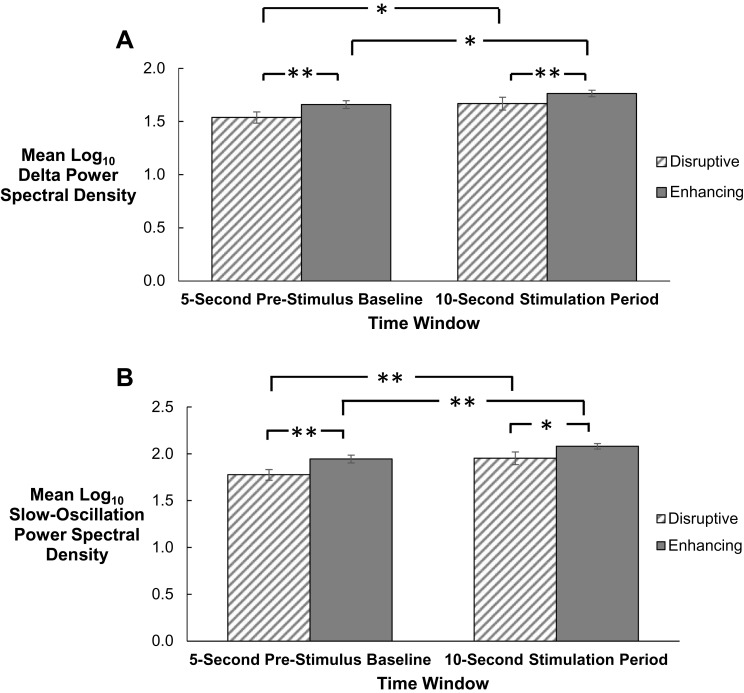
Figure 2.
(A and B) Mean log10 delta (0.5–4 Hz; A) and mean log10 slow-oscillation (0.5–1 Hz; B) power spectral density (PSD) within the 5-sec pre-stimulus baseline and 10-sec post-stimulus period, separately for auditory stimulation delivered within the Disruptive and Enhancing conditions. Auditory stimulations were included in analyses if delivered out of stages N2 and N3, did not lead to an arousal, and were not ended early by the experimenter. Within each condition, log10 delta and slow-oscillation PSD in the post-stimulus period were significantly increased relative to the pre-stimulus period. In addition, during both the 5-sec baseline and the 10-sec stimulation period, log10 delta and slow-oscillation PSD in the Enhancing condition were greater than log10 PSD in the Disruptive condition. Error bars represent standard error of the mean. *p < .05, **p < .005.

