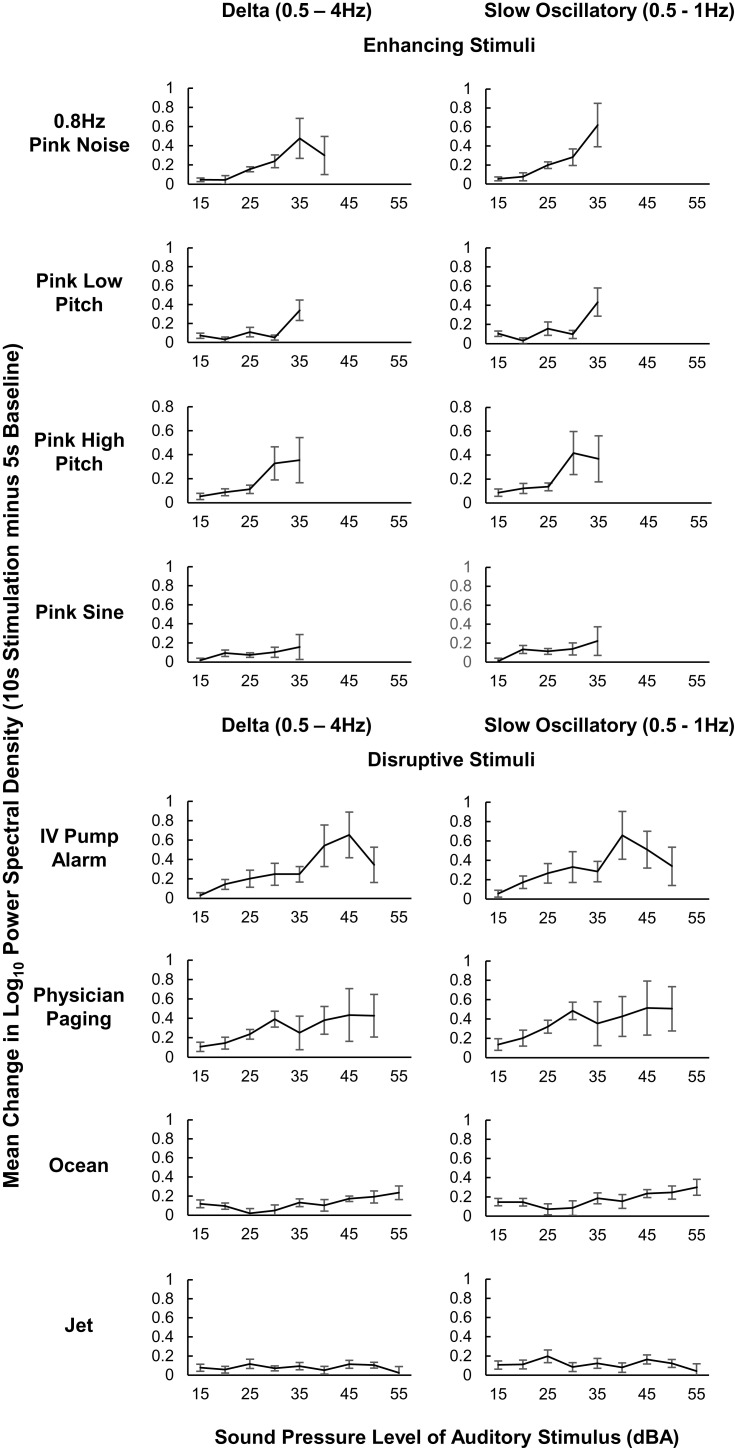
Figure 3.
Mean change in delta (0.5–4 Hz) and slow oscillatory (0.5–1 Hz) frequency power spectral density between baseline (5 sec preceding stimulation) and auditory stimulation (10 sec during stimulation; y-axes) for stimuli initiated during N2 and N3 sleep that did not result in sleep disturbance. Participants must have had at least 2 qualifying instances of a stimulus (panels) at a given dBA level (x-axes) to contribute to each data point average. Averages across fewer than 3 participants are not presented; however, all data were included in the linear mixed model analysis. PSD, power spectral density; dBA: decibel.

