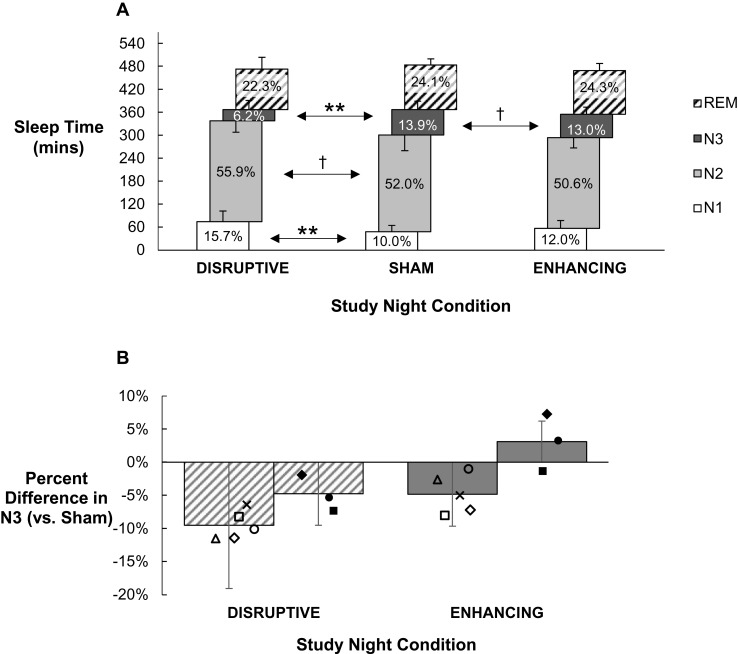
Figure 4.
(A) Mean time (in minutes, y-axis) and percentage of TST (data labels) spent in each sleep stage on the Disruptive and Enhancing condition nights relative to Sham night across eight participants. The ordinate is in 1-hr (60-min) intervals. Error bars represent standard deviation. Participants spent significantly less time in N3 on the Disruptive night than Sham that included a significant Condition*Order interaction. N1 time was significantly greater on the Disruptive night than on Sham. **p < .005, †p < .100 (marginally significant), in comparisons of stage percentage. (B) Mean percent difference in N3 sleep between the Disruptive and Enhancing condition nights versus the Sham night, with markers indicating individual participant differences. Filled markers represent participants randomized to the Enhancing condition on Night 2 (two nights prior to Disruptive) and open or letter markers represent participants randomized to the Disruptive condition on Night 2 (two nights prior to Enhancing). Error bars represent standard deviation. Percent N3 was greater in the Enhancing condition than Sham only when Sham did not coincide with a rebound effect following a Disruptive night (ie, only when Enhancing was presented on Night 2, two nights prior to Disruptive).

