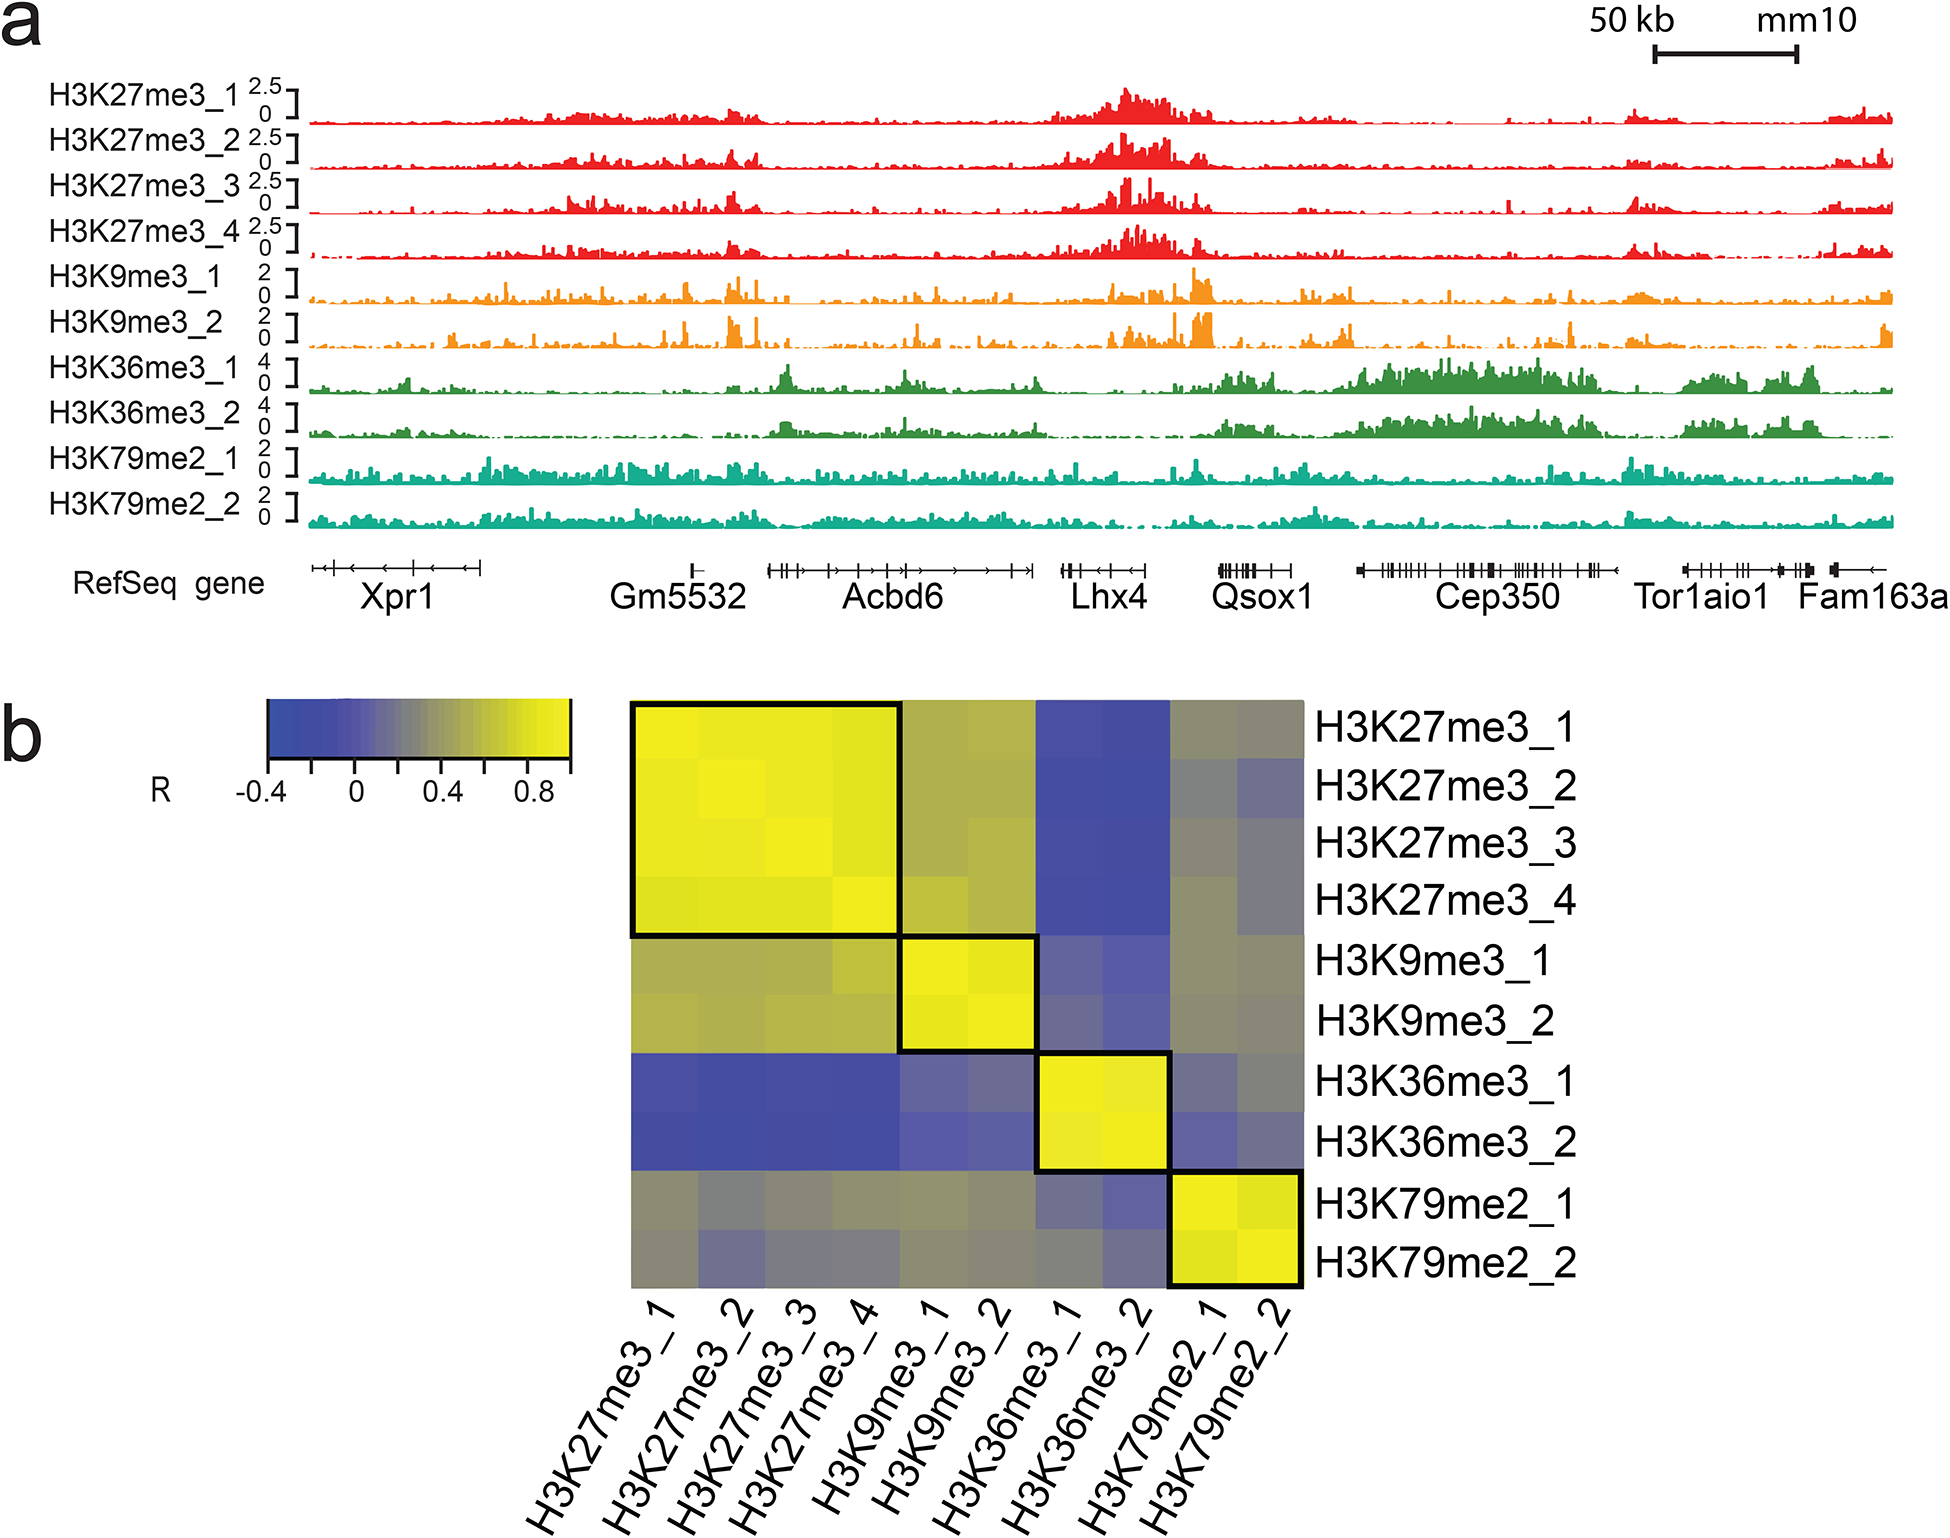
Figure 8 |.

MOWChIP-seq data on H3K27me3, H3K9me3, H3K36me3, and H3K79me2 generated using 1000 nuclei from mouse prefrontal cortex per assay. H3K27me3 data (4 replicates) were produced by 4 units of an 8-unit MOWChIP device while H3K9me3, H3K36me3, and H3K79me2 data (2 replicates each) were produced by 6 units of another 8-unit MOWChIP device. 10-week old CD-1 male mice were used in the study. The nuclei were not sorted and included neurons and glia. The animal protocol was approved by the Institutional Animal Care and Use Committee (IACUC) of Virginia Commonwealth University. (a) Normalized H3K27me3, H3K9me3, H3K36me3, and H3K79me2 signal. (b) Cross correlations of H3K27me3, H3K9me3, H3K36me3, and H3K79me2 ChIP-seq signals in the promoter regions. R represents Pearson correlation coefficient.
