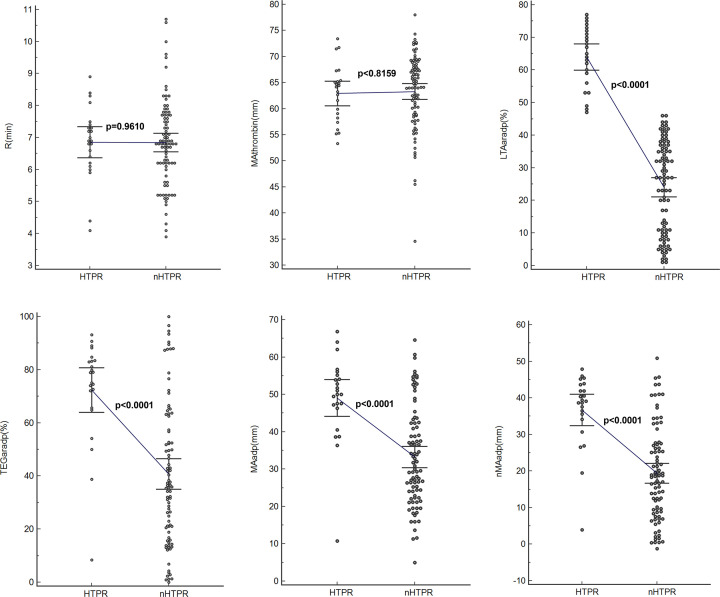
Figure 3. Comparisons of variables between HTPR and nHTPR determined by LTA and TEGpm.
TEGpm, thromboelastography with platelet mapping; TEGaradp, percentage of platelet aggregation rate induced by adenosine diphosphate (ADP) detected by TEGpm; MAthrombin, maximum amplitude (MA) induced by thrombin; MAadp, MA induced by ADP; MAfibrin, MA due to fibrin crosslink; R: time of coagulating factor reaction indicating thrombin generation; nMAadp, net MAadp; LTA, light transmittance aggregometry; LTAaradp, percentage of platelet aggregation rate induced by ADP detected by LTA.

