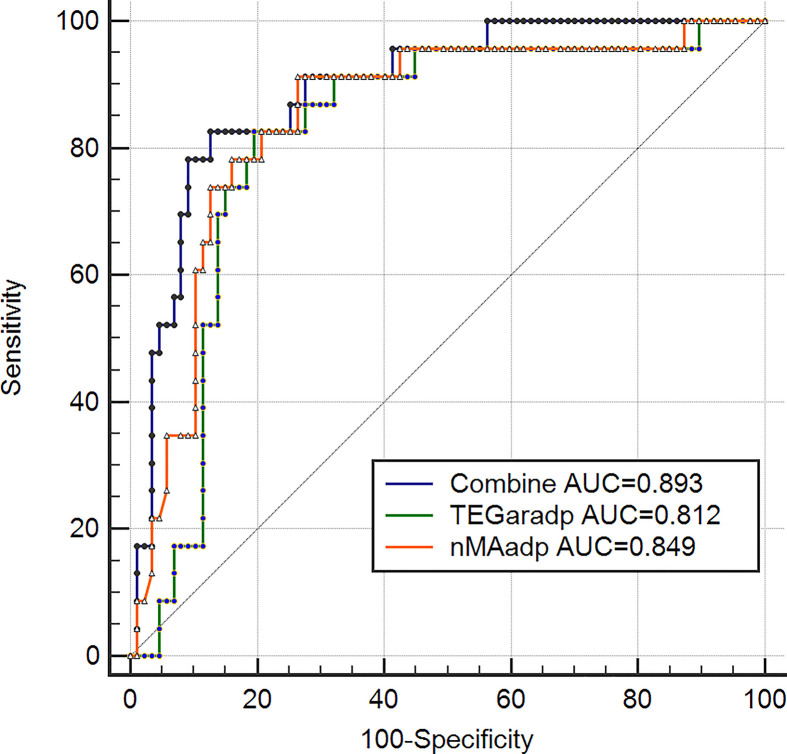
Figure 5. Combined receiver operating characteristic (ROC) curves of TEGpm variables for HTPR.
TEGpm, thromboelastography with platelet mapping; TEGaradp, percentage of platelet aggregation rate induced by adenosine diphosphate (ADP) detected by TEGpm; nMAadp, net maximum amplitude induced by ADP; combine, combination of nMAadp and TEGaradp; LTAaradp, percentage of platelet aggregation rate induced by ADP; HTPR, high on treatment platelet reactivity; ROC analyses based on HTPR defined by LTAaradp >46%. LTAaradp, percentage of platelet aggregation rate induced by ADP detected by LTA.

