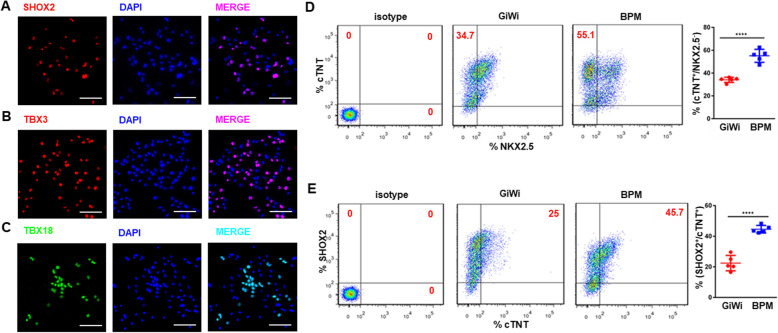
Fig. 5.
Validation of the enriched differentiation of SANLC by the BMP4/PD/BMS (BPM). a–c Representative IF analysis showed that SANLCs expressed SAN-specific transcription factor, SHOX2, TBX3, and TBX18. Scale bars, 100 μm (× 400). d Representative flow cytometry analysis showed that BPM significantly increased the percentage of CTNT+/NKX2.5− cells as compared to the GiWi group (t test, ***p < 0.001 versus GiWi control; n = 5). e Representative flow cytometry analysis showed that BPM significantly increased the percentage of CTNT+/SHOX2+ cells as compared to the GiWi group (t test, ***p < 0.001 versus GiWi control; n = 5). Data are presented as “mean ± SD”

