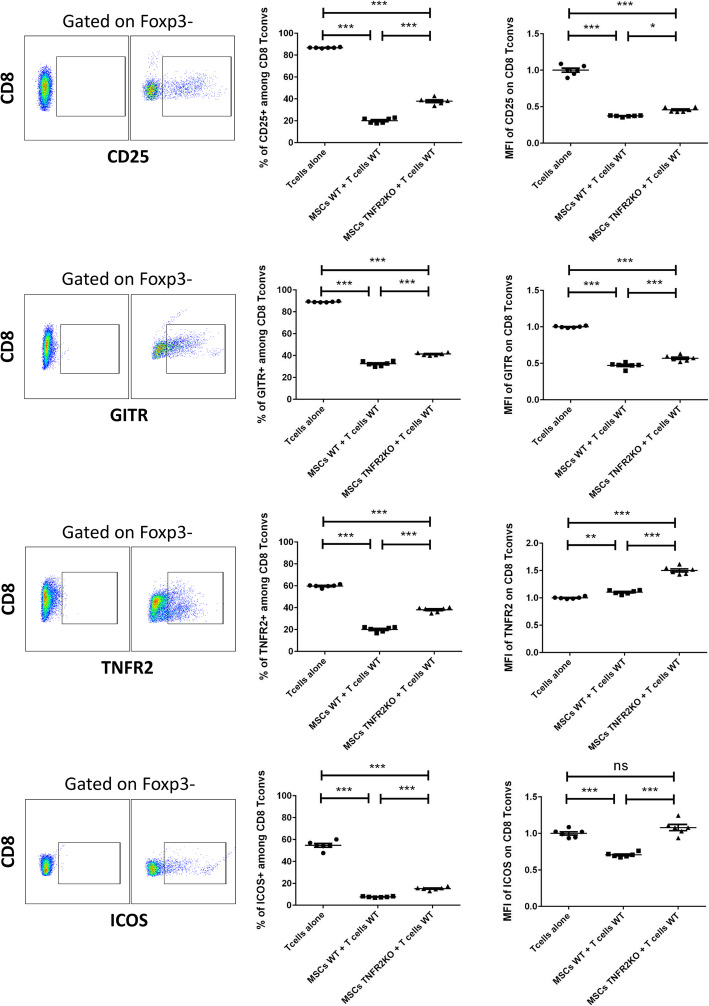
Fig. 4.
The expression of TNFR2 on MSCs is directly correlated to their higher immunomodulation of CD8+ T convs. Activated CD3+ effector T cells were co-cultured with MSCs WT or TNFR2 KO in a fixed 1/5 ratio. After 3 days, T cells were collected and different activation markers were studied. Cells were gated on CD8+Foxp3− T conventional cells. For each marker, the strategy of gating is indicated on the left (y-axis) and below (x-axis) the figure. The x-axis represents each activation marker, and the y-axis represents the CD8 population. Left dot plots represent the Fluorescence Minus One (FMO) controls, and right dot plots represent the main samples. Each dot represents a measured value (n = 6) collected from 2 different experiments. For each group of values, horizontal lines represent the mean value and standard error of the mean. MFI values have been normalized with the T cells alone control group. One-way ANOVA analysis was performed to generate P values. ns, non-significant; *P < .05, **P < .01, ***P < .001, ****P < .0001

