Fig. 6.
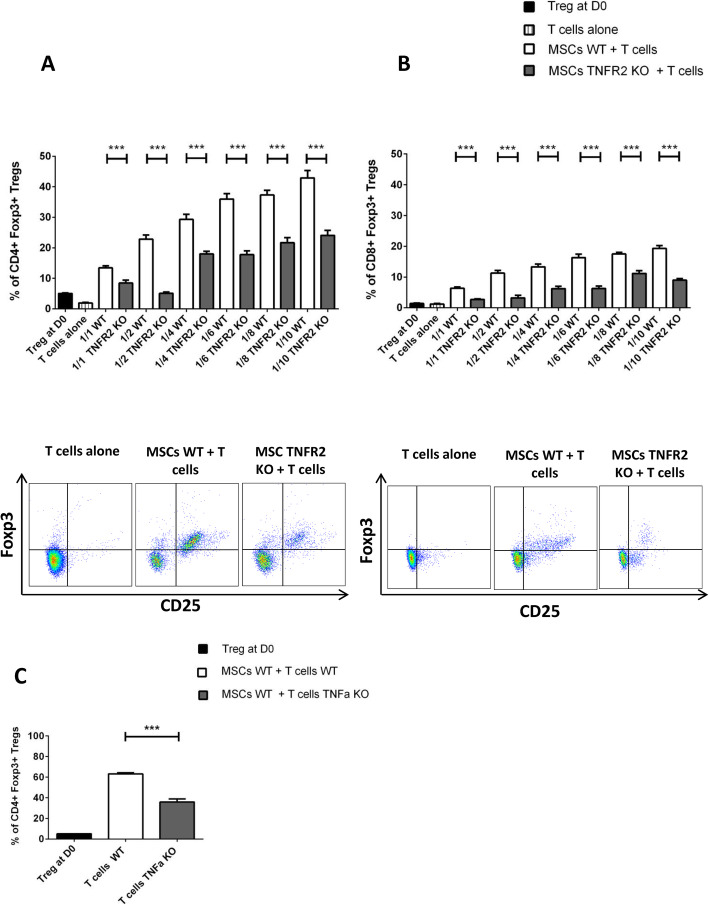
Expression of TNFR2 by MSCs is directly correlated to their higher Foxp3 T reg induction capacity. Activated CD4+ or CD8+ effector T cells were co-cultured with MSCs WT or TNFR2 KO in different ratios (n = 9). After 3 days, the expression of Foxp3 among CD4+ T cells (a) and CD8+ T cells (b) was measured by flow cytometry. Cells were gated on CD4+CD25+Foxp3+or CD8+CD25+Foxp3+ T cells. The gating strategy is indicated on the left and under the figures. The first black bar represents the percentage of Foxp3-expressing cells among total effector T cells used in co-cultures at day 0 (n = 9) while the second bar represents the percentage of Foxp3-expressing T cells alone after 3 days of culture (n = 9). (c) CD4+ T cells collected from the spleen of WT or TNFα deficient mice were co-cultured with MSCs WT. Cells were gated on CD4+CD25+Foxp3+. Data are represented as the mean value ± SEM collected from 3 different experiments. One-way ANOVA or unpaired Student t test analysis was performed to generate P values; ***P < .001. D0, day 0

