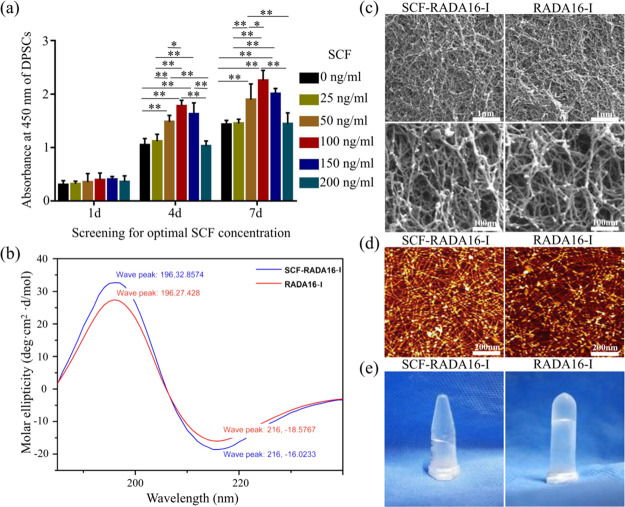
Figure 1.
Screening optimal concentration of SCF and schematic illustrations of RADA16-I and SCF-RADA16-I. (a) Screening optimal concentration of SCF (*P < 0.05, **P < 0. 01). (b) Typical CD spectrum of SCF-RADA16-I and RADA16-I. (c) Typical SEM morphologies of SCF-RADA16-I and RADA16-I. (d) Representative AFM images of SCF-RADA16-I and RADA16-I. (e) SCF-RADA16-I and RADA16-I form hydrogel scaffolds under physiological conditions.

