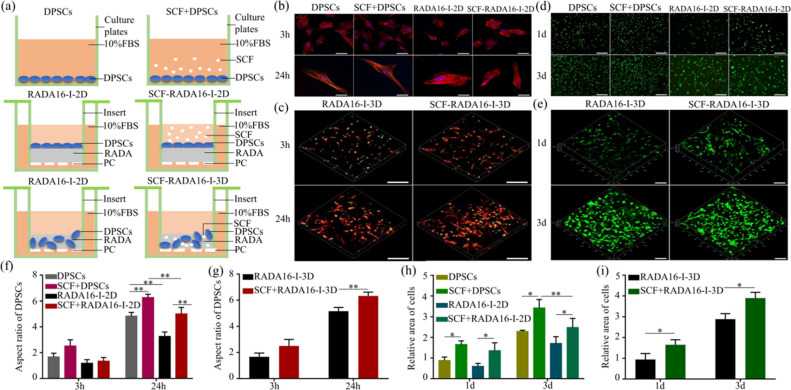
Figure 2.
Effect of SCF-RADA16-I on adhesion and activity of DPSCs. (a) Schematic diagram of groups: DPSC group: DPSCs were directly inoculated on 24-well plates; SCF + DPSC group: DPSCs were inoculated on the plates, and we added SCF to the culture medium; RADA16-I-2D group: RADA16-I was injected into the insert chamber and completed the self-assembly process, and then we inoculated DPSCs on the surface of RADA16-I; SCF-RADA16-I-2D group: we added SCF to the culture medium on the base of group RADA16-I-2D; and RADA16-I-3D group: RADA16-I in the solution state was mixed with DPSCs, which were resuspended in sucrose solution, and they were put into the insert chamber; SCF-RADA16-I-3D group: RADA16-I in the solution state was mixed with SCF and DPSCs, which were resuspended in sucrose solutions, and they were injected into the insert chamber. (b, d) Representative images of two-dimensional cultures and (f, h) the corresponding statistical analysis . (c, e) The images of three-dimensional cultures were taken and (g, i) statistically analyzed. F-actin was dyed into red by phalloidin. The nucleus was dyed into blue by DAPI and dyed into green by SYTOX Green. (*P < 0.05, **P < 0. 01). Scale bar: 100 μm (b, d) and 200 μm (c, e).

