
Figure 7.
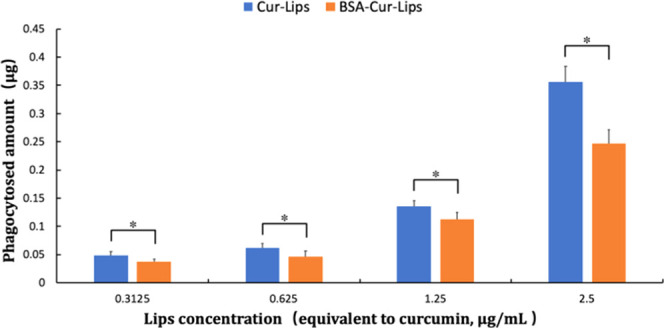
Phagocytosis amounts of Cur-Lips and BSA-Cur-Lips with different concentrations after incubation with mouse macrophages Raw264.7. Data are presented as mean ± s.d. (n = 3). *P < 0.05.
Official websites use .gov
A
.gov website belongs to an official
government organization in the United States.
Secure .gov websites use HTTPS
A lock (
) or https:// means you've safely
connected to the .gov website. Share sensitive
information only on official, secure websites.
Phagocytosis amounts of Cur-Lips and BSA-Cur-Lips with different concentrations after incubation with mouse macrophages Raw264.7. Data are presented as mean ± s.d. (n = 3). *P < 0.05.